Indexed In
- Open J Gate
- Genamics JournalSeek
- Academic Keys
- ResearchBible
- Cosmos IF
- Access to Global Online Research in Agriculture (AGORA)
- Electronic Journals Library
- RefSeek
- Directory of Research Journal Indexing (DRJI)
- Hamdard University
- EBSCO A-Z
- OCLC- WorldCat
- Scholarsteer
- SWB online catalog
- Virtual Library of Biology (vifabio)
- Publons
- Geneva Foundation for Medical Education and Research
- Euro Pub
- Google Scholar
Useful Links
Share This Page
Journal Flyer

Open Access Journals
- Agri and Aquaculture
- Biochemistry
- Bioinformatics & Systems Biology
- Business & Management
- Chemistry
- Clinical Sciences
- Engineering
- Food & Nutrition
- General Science
- Genetics & Molecular Biology
- Immunology & Microbiology
- Medical Sciences
- Neuroscience & Psychology
- Nursing & Health Care
- Pharmaceutical Sciences
Research Article - (2025) Volume 14, Issue 2
Exploring Environmental Impact: Assessing Land Cover Dynamics in Rupandehi District Using Remote Sensing Techniques
Hritik Bhattarai* and Vivek DumreReceived: 24-Apr-2024, Manuscript No. AGT-24-25547; Editor assigned: 29-Apr-2024, Pre QC No. AGT-24-25547 (PQ); Reviewed: 14-May-2024, QC No. AGT-24-25547; Revised: 17-Jun-2025, Manuscript No. AGT-24-25547 (R); Published: 24-Jun-2024, DOI: 10.35248/2168-9891.25.14.406
Abstract
Land use and land cover play a crucial role in preserving and managing earth's natural resources. Various factors, such as economic, demographic, social, cultural, technological and environmental processes, contribute to changes in Land Use and Land Cover (LULC). Rupandehi District is significantly influenced by a combination of driving forces, including its geographical location, rapid population growth, economic opportunities, globalization, tourism activities and political events. Urbanization and urban growth in the region have been occurring in an unplanned manner, with internal migration and natural population growth being the primary contributors. Internal migration, particularly from neighboring districts in the higher and lowers Himalayan regions, has been high, leading to increased population growth and density. This study utilizes geo spatial technology, specifically Geographic Information System (GIS), to analyze and illustrate the land cover and land use changes in Rupandehi district for the years 2009 and 2019, using freely available Landsat images. The identified land cover categories include built-up area, cropland, Das-gaja, forest, grassland, other woodland, riverbed and water. The statistical analysis of the data over the 10-year period (2009-2019) reveals significant percentage changes in LULC. Notably, Das-Gaja shows a minimal change of 99.9%, while water and forest exhibit increases of 34.5% and 98.6%, respectively. Riverbed and Built-Up Area experience changes of 95.3% and 39.6%, respectively. Cropland and Grassland, however, show concerning decreases of 102.6% and 140.0%, respectively. Other woodland also indicates a change of 50.6%. The most noteworthy trends are the substantial increase in water areas and built up areas, leading to the degradation of agricultural and open spaces. This emphasizes the urgent need for effective urban planning activities to ensure the development of a sustainable city. While Das-Gaja seems unaffected, the decreasing trends in cropland and grassland, accompanied by the increasing built-up areas, are unsatisfactory. It is imperative for relevant authorities to be aware of these trends and implement proactive measures for sustainable urban development.
Keywords
Land use and land cover; Geospatial; Urbanization; Geographic information system; Sustainable urban development
Introduction
Land Use Land Cover (LULC) dynamics serves as a crucial parameter in current strategies and policies for natural resource management and monitoring. Currently, the world has witnessed the importance of LULC changes in world-wide environmental modifications that can lead to adverse effects Since humans have controlled fire and domesticated plants and animals, they have cleared forests to wring higher value from the land. About half of the ice-free land surface has been converted or substantially modified by human activities over the last 10,000 years. A recent study estimated that undisturbed (or wilderness) areas represent 46% of the Earth’s land surface (Briassoulis). Land use or land cover is two different terminologies that were found to be applied interchangeably in various literatures.
Land cover is described as the biophysical pattern in the Earth’s surface that denotes various cover like vegetation, built-up, water and other man-made physical features. This term seems to originate originally by referring to the vegetation only but later broadened to include human structures like building, roads etc. While land use refers to the way and intention that the human manipulates the biophysical attributes for meeting their socioeconomic demand.
The use of land has been changing ever since humans first began to manage their environment. Land use refers to the way and intent that the human manipulates the biophysical attributes for meeting their socioeconomic requirements. GIS serves as a scientific instrument for handling geographic data, playing a crucial role in the integration, collection, processing and analysis of various facets of real-world geographic information. The exposure of spatio temporal change in Land Use/Land Cover (LULC) and is very essential to obtain sustainable land management which is understood as a process via which sustainability in its use is obtained by its effective utilization [1].
Objectives
Primary objective:
- To analyse the land use/ land cover changes between 2009-2019 using GIS technique.
Secondary objectives:
- To practically visualize land use and land cover change pattern.
- To deduce the possible reasons for change in land use through GIS and Remote sensing approach.
Materials and Methods
Study area
Rupandehi, situated in the Lumbini Province Nepal, is a significant district known for its cultural, historical and economic importance. The district is characterized by diverse municipalities, rural municipalities and a varied landscape. It has an area of total 1360 sq.km. Rupandehi spans from approximately 27°33' N to 27°58' N latitude and 83°39' E to 84° 26' E longitude. The study area is located 280 kilometers from west of the capital Kathmandu, Nepal. The altitude varies from 100 m to 1299 m from the mean sea level (Figure 1) [2].
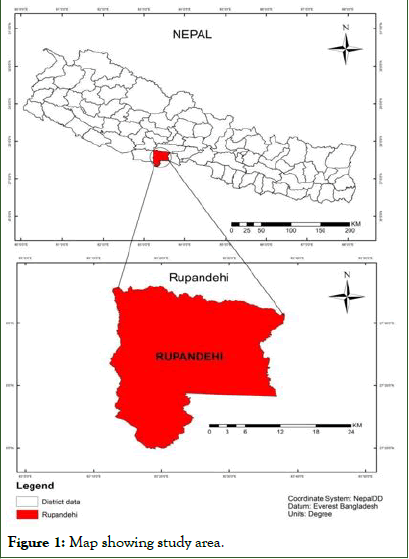
Figure 1: Map showing study area.
As of the 2011 Nepal Census, Rupandehi district had a population of 163,916 households and 880,196 people (432,193 men and 448,003 women). Rupandehi has experienced distinct urbanization trends, influenced by internal migration and natural population growth. Urbanization rates, migration patterns and population density are key factors shaping the district's development. Rupandehi economic landscape is shaped by diverse sectors, including agriculture, industry and services. The region's natural resources, including rivers and agricultural land, contribute to both economic prosperity and environmental considerations. Rupandehi, with its rich cultural heritage and natural attractions, has the potential to be a tourist destination. Understanding the delicate balance between development and conservation is crucial for sustainable tourism growth [3].
Methods
All the procedures of acquisition of datasets, processing and techniques applied for refining them and determining land use and land cover changes are highlighted below. The study was based on secondary data information (Figure 2).
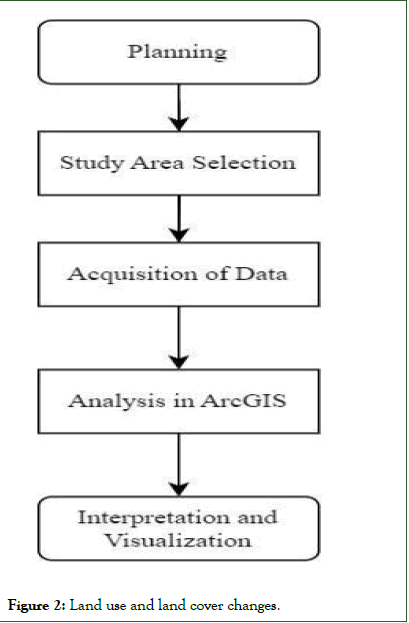
Figure 2: Land use and land cover changes.
The study was based on secondary data information. Landsat images for the years 2009 and 2019 with the time interval of decades were acquired for land cover change analysis. For image preprocessing, processing and classification ArcGIS Software was used. Seven different types of land cover classes like water, forest, riverbed, built-up area, cropland, grassland and other wooded land were selected. Our very first step was planning and study area selection. After that data was collected using secondary sources. Give data were analyzed in ArcGIS and final interpretation and visualization was done (Figures 3-7).
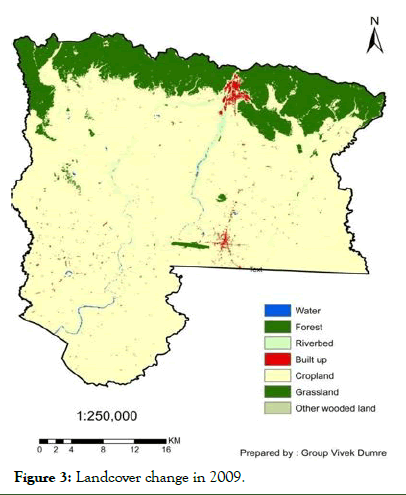
Figure 3: Landcover change in 2009.
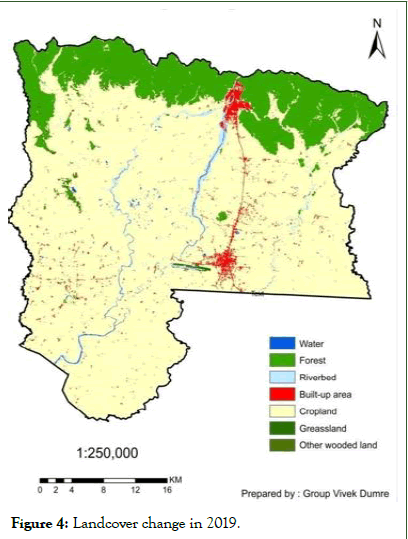
Figure 4: Landcover change in 2019.
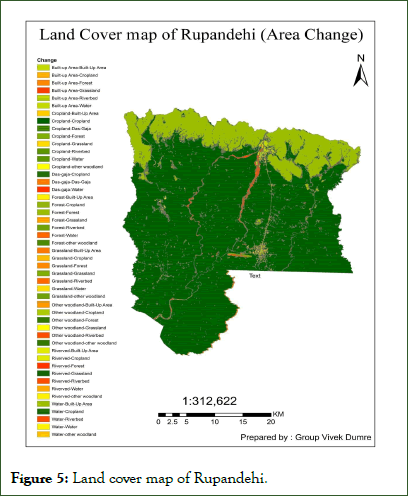
Figure 5: Land cover map of Rupandehi.
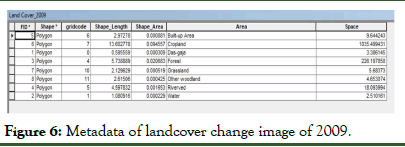
Figure 6: Metadata of landcover change image of 2009.
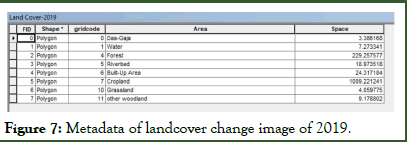
Figure 7: Metadata of landcover change image of 2019.
From the metadata details obtained from the analysis, we can see the water space area has increased while crop area remains somewhat same with the crop area reduction of only 26 units in 10 years’ duration. Riverbed space remains constant while the built up area has increased considerably. There is increase in woodland area. From this result we can see that the built up areas, Land use and urbanization haven’t much hampered the study area. This is the reason there are much scopes for land management and land use planning [4].
Change depiction in figure
The data in the table illustrates changes in land use categories within a specified area from 2009 to 2019. Notably, the Das- Gaja area experienced minimal variation, remaining constant at 3.39 units, suggesting little to no change during the period. Conversely, the water area saw a substantial increase from 2.51 to 7.27 units, indicating a notable expansion of water bodies. Forested land exhibited a moderate growth from 226.20 to 229.26 units, signifying a slight increase in forest cover. The riverbed area expanded significantly by 95.36%, while the builtup area underwent substantial development, more than doubling from 9.64 to 24.32 units (Table 1).
| Area | Change |
| Das-Gaja | 0 |
| Water | 65.49 |
| Forest | 1.33 |
| River Bed | 4.64 |
| Built-Up Area | 60.34 |
| Cropland | -2.6 |
| Grassland | -40 |
| Other Woodland | 49.31 |
Table 1: Showing land use change in units.
Cropland decreased by 102.60%, potentially due to urbanization or shifts in agricultural practices. A noteworthy reduction of 140.00% occurred in grassland, suggesting a significant decline. Conversely, other woodland increased by 50.69%, indicating growth in the area covered by other types of woodland. Overall, these changes reflect dynamic shifts in land use, including urban development, alterations in water bodies and fluctuations in natural landscapes over the specified period. Considering the dynamic shifts in land use revealed by the data from 2009 to 2019, it is evident that the specified area has undergone significant transformations, impacting both natural landscapes and urban development. The stability observed in the Das-Gaja area implies a certain resilience or conservation effort in maintaining the status quo. The substantial increase in water bodies suggests a positive trend in water resource management, but it may warrant further attention to ensure sustainable use and ecological balance. The moderate growth in forested land is promising and efforts to continue promoting afforestation and conservation practices could enhance biodiversity and ecosystem health. The notable expansion of the riverbed area highlights potential implications for water flow and aquatic habitats, necessitating careful monitoring and management strategies. The remarkable development in built-up areas calls for thoughtful urban planning to balance infrastructure needs with environmental sustainability. The decrease in cropland, possibly due to urbanization or shifts in agriculture, prompts considerations for land-use policies that balance urban growth with agricultural sustainability. The significant reduction in grassland underscores the need for conservation efforts to preserve natural habitats and biodiversity. Conversely, the growth in other woodland suggests opportunities for targeted reforestation or afforestation initiatives. In summary, a comprehensive and sustainable land management approach, encompassing urban planning, water resource management, afforestation and conservation efforts, is crucial to navigate the evolving landscape and ensure a harmonious coexistence of human activities and natural ecosystems in the specified area (Figure 7 and Table 2) [5,6].
Figure 7: Bar graph showimg percentage of land use change.
| Change (09-19) | Area change (ha) | Change (09-19) | Area change (ha) |
| Built-up area-Grassland | 0.019775 | Riverved-built-up area | 46.31357 |
| Das-Gaja-Water | 0.033401 | Other woodland-cropland | 59.27718 |
| Built-up area-Forest | 0.077487 | Forest-grassland | 65.77688 |
| Forest-water | 0.087317 | Cropland-grassland | 76.49553 |
| Das-Gaja-cropland | 0.107822 | Grassland-riverbed | 84.77845 |
| Water-other woodland | 0.114047 | Grassland-other woodland | 99.14269 |
| Cropland-Das-Gaja | 0.143475 | Grassland-forest | 102.3792 |
| Other woodland-built-up area | 0.224289 | Other woodland | 140.1805 |
| Forest-riverbed | 0.589872 | Forest-cropland | 162.8873 |
| Grassland-water | 0.790932 | Water-water | 189.9636 |
| Other woodland-riverbed | 0.95696 | Grassland-grassland | 233.9709 |
| Riverved-forest | 1.126349 | Other woodland-forest | 237.0091 |
| Water-built-up area | 1.500909 | Riverved-cropland | 240.9184 |
| Riverved-other woodland | 1.57329 | Forest-other woodland | 245.1378 |
| Forest-built-up area | 1.847917 | Riverved-water | 247.9371 |
| Built-up area-water | 1.8664 | Cropland-water | 286.4907 |
| Riverved-grassland | 2.264487 | Das-gaja-das-gaja | 338.4733 |
| Built-up area-riverbed | 5.477803 | Cropland-other woodland | 431.0626 |
| Grassland-built-up area | 7.367963 | Cropland-forest | 442.2119 |
| Built-up area-cropland | 17.53777 | Cropland-riverbed | 499.6629 |
| Water-cropland | 22.7911 | Built-up area-built-up area | 939.445 |
| Other woodland-grassland | 27.4497 | Riverved-riverbed | 1269.002 |
| Water-riverbed | 36.64614 | Cropland-built-up area | 1434.93 |
| Grassland-cropland | 39.87832 | Forest-forest | 22140.32 |
Table 2: Showing all the criteria of the land with its changes in area (ha).
Results and Discussion
The analysis of Rupandehi's land use dynamics spanning the years 2009 to 2019 unveils a combination of positive and concerning trends, offering insights into the region's environmental and socio economic evolution.
Positive
There is a commendable expansion in forest cover during this period, signaling potential reforestation initiatives or natural regeneration. This growth in wooded areas is significant not only for environmental sustainability but also for fostering biodiversity, as forests play a crucial role in supporting diverse ecosystems. Moreover, the observed infrastructure development, characterized by centripetal growth around cities and improvements in transportation, reflects an encouraging trend in urbanization. This concentrated growth can contribute to increased efficiency in urban living and unlock economic potential within the region. Additionally, the transformation of barren lands into cropland is a positive aspect, holding promise for bolstering food security. The diversification of land use from agriculture to forested areas also indicates a multifaceted approach to land management, potentially involving land reclamation efforts or a shift away from traditional agricultural practices. However, amidst these positive trends, it is crucial to acknowledge some areas of concern, such as the reduction in agricultural lands. While this may signify positive changes in terms of environmental conservation and reforestation, it could also raise questions about potential challenges for the agricultural sector and the livelihoods it supports. Therefore, a comprehensive understanding of these land use dynamics is essential for informed decision-making and sustainable development in Rupandehi [7-10].
Concerns
The unfolding land use changes in Rupandehi from 2009 to 2019 also bring to light several challenges that necessitate careful consideration. One pressing concern is the rapid and unplanned urban sprawl, particularly prevalent in the Western regions, which raises alarms regarding resource management, strained infrastructure and potential social inequities. The haphazard expansion, characterized by a leapfrogging tendency, signifies a need for comprehensive urban planning strategies to ensure sustainable growth that balances development with environmental and societal well-being. Addressing these concerns is crucial to avoid detrimental consequences associated with uncontrolled urbanization, such as environmental degradation and uneven distribution of resources.
Moreover, the noticeable reduction in water bodies demands thorough investigation and proactive measures to safeguard water security, especially with a growing population. This decline could be attributed to various factors, including increased urbanization, changes in precipitation patterns or alterations in water management practices. Developing effective water conservation and management plans is imperative to mitigate potential water scarcity issues and ensure a sustainable water supply for both urban and rural communities [11,12].
Another potential issue highlighted in the evolving land use scenario is the encroachment on farmlands due to urban sprawl and internal migration. This encroachment poses a substantial risk to agricultural lands and, consequently, long-term food security. Balancing urban development with the preservation of fertile agricultural areas is essential to address the rising demand for housing and infrastructure without compromising the region's ability to sustain its agricultural productivity. Implementing land-use policies that safeguard agricultural lands can contribute to securing the region's food sources and supporting the livelihoods of local communities [13,14].
Opportunities
The need for a strategic Land Use Planning (LUP) strategy in Rupandehi is emphasized by the changing trends, emphasizing the urgency to balance urban expansion with environmental conservation, support sustainable agriculture and improve the overall well-being of local communities. Additionally, optimizing the management of water, forest resources and other natural assets presents an opportunity to propel Rupandehi toward a prosperous and sustainable future, ensuring the region's resilience amidst shifting land use patterns and population growth [15].
Conclusion
Utilizing detailed data on all land use changes can help create a comprehensive picture of the area's dynamics. It underscores the alignment of the discussed principles with key Sustainable Development Goals (SDGs) established by the United Nations. It underscores the importance of comprehensive land use planning to foster sustainable urban expansion, a goal resonating with SDG 11's focus on creating cities that are inclusive, safe, resilient and sustainable. Furthermore, the interconnectedness of different land uses, such as agriculture, water resources, forests and built environments, aligns with SDG 15's objective of safeguarding terrestrial ecosystems. The emphasis on sustainable land use planning as essential for environmental protection corresponds with SDG 13's call for action against climate change. While not explicitly stated, the implication that these practices can contribute to poverty reduction and food security aligns with the objectives of SDG 1 (No Poverty) and SDG 2 (Zero Hunger). The collaborative involvement of local communities, policymakers and experts echoes the spirit of SDG 17, which underscores the importance of partnerships to achieve overarching goals. Additionally, the text implies a commitment to gender-inclusive practices, contributing to the broader aim of achieving gender equality as outlined in SDG 5. In essence, the text advocates for an integrated, evidence-driven and inclusive land use planning approach, demonstrating a commitment to various SDGs and fostering sustainable development in the specified region of Rupandehi.
Recommendations
This can inform sustainable planning decisions for urban expansion, agricultural practices and environmental protection. Land management and planning should go beyond individual aspects like cropland or built-up areas. Considering the interconnectedness of all land uses-agriculture, water resources, forests and built environment-is crucial for ensuring long-term sustainability. Involving local communities inclusive of all, policymakers and experts in the planning process is vital for effective land management. This ensures plans are aligned with local needs, priorities and indigenous knowledge. The observed changes demand immediate attention from policymakers, urban planners and local communities. Implementing a data-driven and stakeholder-inclusive LUP strategy is crucial to ensure Rupandehi's growth remains balanced, resilient and beneficial for all.
References
- Briassoulis H. Combating land degradation and desertification: The land-use planning quandary. Land. 2019;8:27.
- Gairhe S, Timsina KP, Ghimire YN, Lamichhane J, Subedi S, Shrestha J. Production and distribution system of maize seed in Nepal. Heliyon. 2016;7:e06775.
- Hussain S, Mubeen M, Karuppannan S. Land Use and Land Cover (LULC) change analysis using TM, ETM+ and OLI Landsat images in district of Okara, Punjab, Pakistan. Phy Chem Earth. 2015;126:103117.
- Lambin EF, Geist HJ, Lepers E. Dynamics of land-use and land-cover change in tropical regions. Annual Review Env Res. 2003;28:205-241.
- Lira PK, Ewers RM, Banks-Leite C, Pardini R, Metzger JP. Evaluating the legacy of landscape history: Extinction debt and species credit in bird and small mammal assemblages in the Brazilian Atlantic forest. J App Ecol. 2012;49:1325-1333.
- Rawat JS, Kumar M. Monitoring land use/cover change using remote sensing and GIS techniques: A case study of Hawalbagh block, district Almora, Uttarakhand, India. Egyptian J Remote Sensing Space Sci. 2016;18:77-84.
- Rawat JS, Kumar M. Monitoring land use/cover change using remote sensing and GIS techniques: A case study of Hawalbagh block district Almora Uttarakhand India. Egyptian J Remote Sen Space Sci. 2015:18:77-84.
- Aitken RL, Moody PW, McKinley PG. Lime requirement of acidic Queensland soils. I. Relationships between soil properties and pH buffer capacity. Soil Res. 1990;28(5):695-701.
- Chintala R, McDonald LM, Bryan WB. Grouping soils by taxonomic order to improve lime recommendations. Commun Soil Sci Plant Anal. 2010;41(13):1594-603.
- Aitken RL, Moody PW, McKinley PG. Lime requirement of acidic Queensland soils. II. Comparison of laboratory methods for predicting lime requirement. Soil Res. 1990;28(5):703-715.
- Cantarella H, van Raij B, Quaggio JA. Soil and plant analyses for lime and fertilizer recommendations in Brazil. Commun Soil Sci Plant Anal. 1998;29(11-14):1691-1706.
- Barouchas PE, Moustakas N, Liopa-Tsakalidi A. A rapid procedure to calculate lime requirements based on single titration with base. Arch Agron Soil Sc. 2013;59(2):317-325.
- Alatas J, Tsadilas CD, Sgouras J. Comparison of two methods of lime requirement determination. Arch Agron Soil Sci. 2005;36(1-3):183-190.
- Machacha S. Comparison of laboratory pH buffer methods for predicting lime requirement for acidic soils of eastern Botswana. Commun Soil Sci Plant Anal. 2004;35(17-18):2675-2687.
- Badalucco L, Grego S, Dell'Orco S, Nannipieri P. Effect of liming on some chemical, biochemical and microbiological properties of acid soils under spruce (Picea abies L.). Biol Fertil Soils. 1992;14:76-83.
Citation: Bhattarai H, Dumre V (2025) Exploring Environmental Impact: Assessing Land Cover Dynamics in Rupandehi District Using Remote Sensing Techniques. Agrotechnology. 14:406.
Copyright: © 2025 Bhattarai H, et al. This is an open-access article distributed under the terms of the Creative Commons Attribution License, which permits unrestricted use, distribution and reproduction in any medium, provided the original author and source are credited.
