
Indexed In
- Open J Gate
- Genamics JournalSeek
- JournalTOCs
- RefSeek
- Hamdard University
- EBSCO A-Z
- OCLC- WorldCat
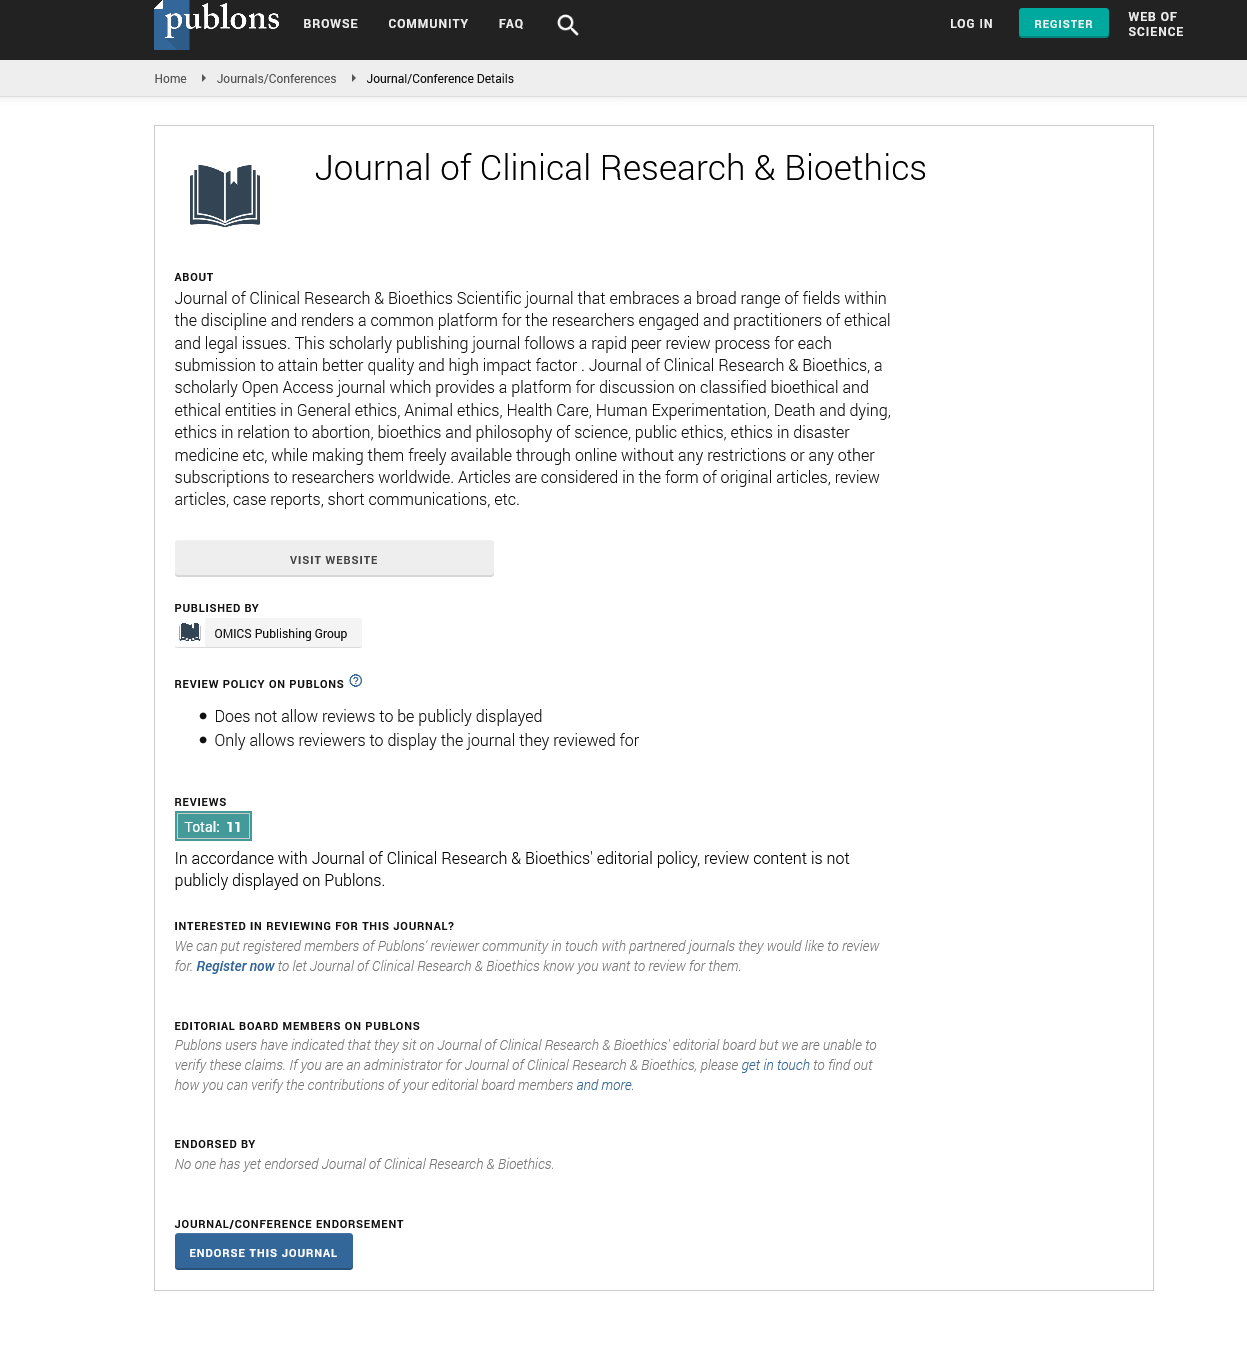
- Publons
- Geneva Foundation for Medical Education and Research
- Google Scholar
Useful Links
Share This Page
Journal Flyer

Open Access Journals
- Agri and Aquaculture
- Biochemistry
- Bioinformatics & Systems Biology
- Business & Management
- Chemistry
- Clinical Sciences
- Engineering
- Food & Nutrition
- General Science
- Genetics & Molecular Biology
- Immunology & Microbiology
- Medical Sciences
- Neuroscience & Psychology
- Nursing & Health Care
- Pharmaceutical Sciences
Short Communication - (2023) Volume 0, Issue 0
Evaluating Sarcopenia in Liver Disease: Assessment of Skeletal Muscle Mass by Computed Tomography is not Related to MASLD by Liver Biopsy
Carine Luíze Panke1, Gabriela Perdomo Coral1, Fábio Kunihiro Maeda2, Eiji Suwa3, Angelo Alves de Mattos1, Cristiane Valle Tovo1 and Luis Fernando Ferreira1*2Nuclear Medicine Service, Santa Casa de Misericordia de Porto Alegre, RS, 90035-072, Brazil
3Department of Gastroenterology and Hepatology, Hospital Nossa Senhora da Conceição, Porto Alegre, RS, 91350-200, Brazil
Received: 12-Nov-2023, Manuscript No. JCRB-23-23891; Editor assigned: 14-Nov-2023, Pre QC No. JCRB-23-23891 (PQ); Reviewed: 28-Nov-2023, QC No. JCRB-23-23891; Revised: 05-Dec-2023, Manuscript No. JCRB-23-23891 (R); Published: 14-Dec-2023, DOI: 10.35248/2155-9627.23.S17.003
Abstract
Background: The relationship between sarcopenia and Metabolic Dysfunction-Associated Steatotic Liver Disease (MASLD) has been widely studied. However, there are still a lack in the knowledge about the best tools to asses sarcopenia in MASLD patients, and what cut-off points for the diagnosis criteria for sarcopenia are suitable for this population.
Objective: T o com par e the Sk ele t al Muscle Mass (SMM) assessed b y Com put ed T omogr aph y (CT) in patients with MASLD assessed by Liver Biopsy (LB). Methods: Cross-sectional study with patients attended at the outpatient clinic in a tertiary hospital of southern Brazil. Were included individual aged >18 years, with MASLD confirmed by LB. The SMM was assessed by the quantification of the transverse area of the third lumbar vertebra (L3) in the CT. The results were analyzed using the test Anova one-way.
Results: 66 patients were included, and analyzed in groups by the level of fibrosis by LB. The mean age was 58.75 years, and most were women (77%; n=51). There was significant difference in diabetes, weight, abdominal circumference, AST levels, bilirubin, LDL cholesterol, all increasing according the level of fibrosis. The SMM were also higher, according to the level of fibrosis, being 46.61+7.28 cm²/m² in F0; 46.30+6.8 in F1; 45.34+11.09 in F2; 55.08+15.97 in F3 and; 50.2+9.09 in F4, although without a difference statistically significant (p=0.172).
Discussion: The CT assess only a transverse area of one muscle, and it has been debated if it represents well the whole-body SMM. Also, the CT is evaluator-dependent, which can lead to analyzing bias.
Conclusion: For this sample, the SMM assessment by CT do not showed difference, and the SMM increasing with worst fibrosis diagnosis go against the state-of-the-art in sarcopenia assessment. Further studies are necessary comparing SMM assessment specifically for liver patients.
Keywords
Sarcopenia; MASLD; Fibrosis; Tomography; NAFLD
Introduction
The relation between Metabolic Dysfunction-Associated Steatotic Liver Disease (MASLD) and sarcopenia have been widely studied in the recent years [1]. They apparently share some physiological pathways, making possible to find a connection in the etiology for both conditions, such as the insulin resistance, the loss of skeletal muscle mass, and the fat accumulation in other tissues, as muscle and hepatocytes [2,3].
Although some consensuses to diagnose sarcopenia have emerged in the last years, the mostly of them are for older people, and not for patients of other conditions, such MASLD [4,5]. So, the main authors in the field are still conducting researches to find ways to diagnose sarcopenia in MASLD patients, that can relate with this specific condition, even trying to define the most appropriate cutoff points for this condition [6,7].
The objective of this study was to compare the results of Skeletal Muscle Mass (SMM) assessment by Computed Tomography (CT) with the MASLD degree evaluated by Liver Biopsy (LB).
Materials and Methods
Observational and prospective study, conducted according the Strengthening the Reporting of Observational Studies in Epidemiology (STROBE) statement guidelines [8]. Patients aged >18 years, diagnosed with MASLD by LB, treated on the Gastroenterology and Hepatology outpatient clinic at Irmandade Santa Casa de Misericordia de Porto Alegre (ISCMPA), a tertiary care hospital in southern Brazil, between 2017 and 2020, were included.
Were excluded patients with hepatitis B or hepatitis C virus; with significant alcohol consumption (>20 g/day for women and >30 g/day for men); with other causes of chronic liver disease; secondary causes of MASLD and; patients with Hepatocellular Carcinoma (HCC) [9].
Liver biopsy was indicated according to the guideline of the American Association for Study of Liver Disease. LB were analyzed by a professional with experience in liver pathology blinded for patient’s data, using the NAFLD Activity Score for histopathological analysis [10]. MASLD was defined according the new classification.
CT was performed to assess muscle mass, by analyzing the transverse area of the third lumbar vertebra (L3), using specific software [11]. For this quantification, L3 was identified, and the transverse area of the abdominal and paravertebral wall muscles involved at the height of L3 was measured. The value obtained in square centimeters was divided by the patient's height (in meters) squared, resulting in the Skeletal Muscle Mass Index (SMI).
Other indicators were also assessed, such as weight and height (calculating the body mass index by dividing weight by height square); clinical conditions, such as Systemic Arterial Hypertension (SAH), type 2 Diabetes Mellitus (DM2), and dyslipidemia; and blood tests as Total Cholesterol (TC), Low- Density Lipoprotein (LDL) and High-Density Lipoprotein (HDL) cholesterol, Triglycerides (TG), Alanine Aminotransferase (ALT), Aspartate Aminotransferase (AST), total and direct bilirubin, prothrombin time, albumin, platelets, glucose, insulin, CReactive Protein (CRP) and ferritin. In addition, resistance to insulin action was estimated through Homeostasis Model Assessment-Insulin Resistance (HOMA-IR) [12].
The Kolmogorov-Smirnov test was used to assess the normality. To compare continuous variables between groups, Independent sample Student’s T-Test was used. The analyzes were processed in the Statistical Package for the Social Sciences program (PASW Statistics for Windows, version 18.0. Chicago: SPSS Inc). The level of significance assumed was 5% and the Confidence Interval (CI) was 95%. The data were analyzed grouping the patients into two different groups: G1 being the patients with less liver impairment (F0, F1 and F2); and G2 the patients with advanced fibrosis (F3) and cirrhosis (F4).
The project was approved by the Research Ethics Committee of the Federal University of Health Sciences of Porto Alegre, under letter nº 57328416.8.0000.5335. Volunteers read and signed the Informed Consent Form. The entire research was conducted following Resolution 196/96 of the National Health Council (Brazil) and adhered to the principles of the Declaration of Helsinki for research involving human subjects. Data were processed in accordance with the General Data Protection Law (Brazilian Law nº 13.709/2018).
Results
The final sample consisted of 66 patients, being mostly women, as can be seen in Table 1. The sample characterization data, such as age, gender and BMI did not showed statistically significant difference. However, some discriminant data were different between the groups, being weight, height, abdominal circumference, AST, bilirubin, insulin and HOMA-IR means significantly higher in G2, as well the prevalence of DM were higher in this group; while total and LDL cholesterol, and platelets were significantly higher in G1.
| Variable* | Group 1 (n=34) |
Group 2 (n=32) |
Total (n=66) |
p |
|---|---|---|---|---|
| SMM (cm²/m²) | 46.28 ± 7.63 | 51.42 ± 11.12 | 48.77 ± 9.76 | .031 |
| Age (Years) | 58.18 ± 9.28 | 59.38 ± 12.28 | 58.76 ± 10.77 | .655 |
| Weight (Kg) | 79.79 ± 12.64 | 89.4 ± 19.04 | 84.45 ± 16.66 | .018¹ |
| Height (m) | 1.57 ± 0.06 | 1.62 ± 0.09 | 1.59 ± 0.08 | .010¹ |
| BMI | 32.31 ± 5.11 | 34 ± 6.84 | 33.13 ± 6.03 | .259 |
| ALT | 32.71 ± 18.45 | 43.03 ± 35.64 | 37.71 ± 28.38 | .141 |
| AST | 28.32 ± 10.28 | 46.69 ± 29.76 | 37.23 ± 23.7 | .001¹ |
| Bilirubin | 0.55 ± 0.33 | 1.18 ± 1.04 | 0.86 ± 0.82 | .002¹ |
| Albumin | 4.45 ± 0.81 | 4.25 ± 0.44 | 4.35 ± 0.66 | .241 |
| Total chol | 207.79 ± 46.74 | 173.32 ± 51.85 | 191.35 ± 51.84 | .006¹ |
| HDL chol | 51.47 ± 14.1 | 48.23 ± 10.87 | 49.92 ± 12.67 | .306 |
| LDL chol | 125.15 ± 41.55 | 85.04 ± 35.02 | 108.68 ± 43.49 | .000¹ |
| Triglycerides | 164.24 ± 55.14 | 179.93 ± 115.88 | 171.71 ± 88.96 | .489 |
| Glucose | 106.82 ± 33.83 | 124.81 ± 46.74 | 115.53 ± 41.27 | .081 |
| Insulin | 15.11 ± 8.92 | 21.78 ± 21.22 | 18.06 ± 10.9 | .045¹ |
| HOMA-IR | 4.34 ± 3.08 | 6.72 ± 3.41 | 5.36 ± 3.4 | .023¹ |
| CRP | 6.45 ± 5.94 | 8.58 ± 10.11 | 7.38 ± 7.99 | .378 |
| Creatinine | 0.79 ± 0.2 | 0.81 ± 0.26 | 0.8 ± 0.23 | .749 |
| Ferritin | 172.93 ± 145.11 | 258.24 ± 337.86 | 212.43 ± 254.28 | .222 |
| Hemoglobin | 13.56 ± 1.34 | 13.47 ± 2.24 | 13.51 ± 1.82 | .837 |
| Platelets | 263.34 ± 76.02 | 174.97 ± 69.97 | 219.86 ± 85.1 | .000¹ |
| Gender: Female | 29 (85.29) | 22 (68.75) | 15 (22.72) | .112 |
| SAH | 24 (70.58) | 26 (81.25) | 50 (75.75) | .320 |
| DM | 15 (44.11) | 24 (75) | 39 (59.09) | .010¹ |
| Dyslipidemia | 12 (35.29) | 21 (65.62) | 37 (56.06) | .133 |
| MS | 11 (32.35) | 23 (71.87) | 38 (57.58) | .310 |
Note: *Continuous data presented in mean+SD; Categoric data presented in n (%); SD: standard deviation; n: total sample; %: relative sample; p: Student’s T test to independent samples; ¹ difference statistically significant; Kg: Kilogram; m: meters; BMI: Body Mass Index; ALT: Alanine Aminotransferase; AST: Aspartate Aminotransferase; Chol: Cholesterol; HDL: High Density Lipoprotein; LDL: Low Density Lipoprotein; CRP: C-Reactive Protein; SMM: Skeletal Muscle Mass; cm²/m²: Centimetre Square by Meter Square; SAH: Systemic Arterial Hypertension; DM: Diabetes Mellitus; MS: Metabolic Syndrome.
Table 1: Sample Characteristics categorized by MASLD levels (n=66).
About the SMM, the mean was statistically higher in G2 than in G1. When divided by stages, is possible to see that the means are below the total mean for stages F0, F1 and F2 (46.62 ± 7.29; 46.31 ± 6.8; 45.34 ± 11.1 cm²/m², respectively), while F3 and F4 are above it (55.08 ± 15.98; 50.209.1 cm²/m², respectively).
Discussion
In this study, although there was a statistically significant difference in Skeletal Muscle Mass (SMM) between G1 and G2, the indices were higher in G2, precisely in those patients with greater hepatic impairment, in the opposite way to that would be expected. Most studies correlating hepatic diseases such as MASLD, fibrosis, and cirrhosis with sarcopenia have reported that muscle mass tends to decrease as liver impairment increases (an inverse correlation) [13,14]. This phenomenon is attributed to the shared physiological pathways between the two conditions. For instance, insulin resistance, closely linked to the onset of hepatic diseases, is also considered a risk factor for sarcopenia.
Apart from the shared physiological pathways, a direct relationship between sarcopenia and MASLD exists, who found that myostatin activation in SMM may be influenced by hepatic malfunction caused by fat accumulation in hepatocytes [15,16].
Additionally, various authors suggest that hepatic diseases decrease the macronutrient absorption rate, influencing protein synthesis in SMM and directly reducing the resynthesize phenomenon, as hepatocytes gradually lose the capacity for synthesis [17,18].
As reported, the reduction in SMM, beyond merely explaining hepatic impairment progression, may activate stellate cells with fibrogenic properties in the liver, thereby increasing the risk of fibrosis, cirrhosis, and hepatocellular carcinoma [19]. Thus, not only can low SMM levels explain advanced hepatic impairment, but greater hepatic impairment can also elucidate SMM reduction.
Considering the literature's solid evidence on the liver diseasesarcopenia relationship, it can be hypothesized that the discrepant result in this sample may be attributed not directly to the sample itself, but rather to the method of assessment employed for SMM quantification.
Although Computed Tomography (CT) is recommended for muscle mass evaluation by most sarcopenia consensuses, being a cheaper test than other options and offering lower radiation levels compared to Dual-Energy X-ray Absorptiometry (DXA) and Magnetic Resonance Imaging (MRI), CT has been discussed for its inherent errors [20].
Firstly, despite a correlation between SMM evaluation by DXA (the gold standard) and CT for elderly patients, this relationship has not been fully explored in patients with other pathologies that may directly affect specific muscle groups or alter the proportion of other body components, such as fluid accumulation (ascites, a common manifestation of hepatic diseases) and intramuscular lipid accumulation (also common in hepatic steatosis) [21].
In these cases, evidence points toward bio-impedance analysis and DXA as more suitable examinations, as they can detect the accumulation of other components in SMM and assess the entire body, unlike CT, which examines only a slice of muscle, generally assessed at the level of the third lumbar vertebra) [22].
CT may also face issues related to equipment calibration and evaluator analysis. Regarding equipment calibration, the assumption that the equipment returns a value of zero for water, expected for a well-calibrated scanner, can be misleading, increasing the risks of precision errors in muscle density determination [23]. Regarding the evaluator, it's important to note that, unlike DXA and Bioelectrical Impedance Analysis (BIA), CT-based SMM assessment is evaluator-dependent, as a professional need to delineate the contours of the muscle being evaluated. Thus, not only there is a possibility of evaluator bias, but the image quality, with shadows or undefined lines, can influence the final assessment result [24].
Conclusion
In conclusion, for this sample, a higher level of hepatic impairment is related with higher amount of SMM level assessed by CT, although there may be a strong influence of the assessment method on the presented results.
The major limitation of this study is that the evaluation of SMM by CT, as reported, may not be the best choice for assessing SMM in sarcopenic hepatic patients due to its significant margin of error and inherent biases in this assessment model. Furthermore, it is recommended that new studies with larger samples be conducted, comparing different methods of SMM evaluation in hepatic patients to validate methods and increase the security and efficacy of collected data.
Funding
This study was financed in part by the Coordenação de Aperfeiçoa-mento de Pessoal de Nível Superior-Brasil (CAPES)- Finance Code 001.
Conflict of Interests
The authors declare not have conflict of interest of any kind for the realization of this study.
References
- Rinella ME, Lazarus JV, Ratziu V, Francque SM, Sanyal AJ, Kanwal F, et al. A multi-society Delphi consensus statement on new fatty liver disease nomenclature. Ann Hepatol. 2023;29(1):10113.
[Crossref] [Google Scholar] [PubMed]
- Ferreira LF, Berleze KJ, Ferreira A, Tovo CV, da Rosa LH. There is no correlation between stages of nafld assessed by liver biopsy and the diagnostic criteria for sarcopenia in active populations: A cross-sectional study. UNIPAR Health Sci Arch. 2023;27(10):5961-5973.
- Tovo CV, Fernandes SA, Buss C, de Mattos AA. Sarcopenia and non-alcoholic fatty liver disease: Is there a relationship? A systematic review. World J Hepatol. 2017;9(6):326.
[Crossref] [Google Scholar] [PubMed]
- Cruz-Jentoft AJ, Bahat G, Bauer J, Boirie Y, Bruyère O, Cederholm T, et al. Sarcopenia: Revised European consensus on definition and diagnosis. Age Ageing. 2019;48(1):16-31.
[Crossref] [Google Scholar] [PubMed]
- Chen LK, Woo J, Assantachai P, Auyeung TW, Chou MY, Iijima K, et al. Asian Working Group for Sarcopenia: 2019 consensus update on sarcopenia diagnosis and treatment. J Am Med Dir Assoc. 2020;21(3):300-307.
[Crossref] [Google Scholar][PubMed]
- Almeida NS, Rocha R, de Souza CA, da Cruz ACS, Ribeiro BDR, Vieira LV, et al. Prevalence of sarcopenia using different methods in patients with non-alcoholic fatty liver disease. World J Hepatol. 2022;14(8):1643-1651.
[Crossref] [Google Scholar] [PubMed]
- Chun HS, Kim MN, Lee JS, Lee HW, Kim BK, Park JY, et al. Risk stratification using sarcopenia status among subjects with metabolic dysfunction-associated fatty liver disease. J Cachexia Sarcopenia Muscle. 2021;12(5):1168-1178.
[Crossref] [Google Scholar] [PubMed]
- Von Elm E, Altman DG, Egger M, Pocock SJ, Gøtzsche PC, Vandenbroucke JP. The Strengthening the Reporting of Observational Studies in Epidemiology (STROBE) statement: guidelines for reporting observational studies. Ann Intern Med. 2007;147(8):573-577.
- Hart CL, Morrison DS, Batty GD, Mitchell RJ, Davey Smith G. Effect of body mass index and alcohol consumption on liver disease: Analysis of data from two prospective cohort studies. BMJ. 2010 Mar 11;340:c1240.
[Crossref] [Google Scholar] [PubMed]
- Kleiner DE, Brunt EM, Van Natta M, Behling C, Contos MJ, Cummings OW, et al. Design and validation of a histological scoring system for nonalcoholic fatty liver disease. Hepatology.2005; 41(6):1313-1321.
[Crossref] [Google Scholar] [PubMed]
- van Vugt JL, Levolger S, Gharbharan A, Koek M, Niessen WJ, Burger JW, et al. A comparative study of software programmes for cross-sectional skeletal muscle and adipose tissue measurements on abdominal computed tomography scans of rectal cancer patients. J Cachexia Sarcopenia Muscle. 2017;8(2):285-297.
[Crossref] [Google Scholar] [PubMed]
- Tahapary DL, Pratisthita LB, Fitri NA, Marcella C, Wafa S, Kurniawan F, et al. Challenges in the diagnosis of insulin resistance: Focusing on the role of HOMA-IR and Tryglyceride/glucose index. Diabetes Metab Syndr. 2022;16(8):102581.
[Crossref] [Google Scholar] [PubMed]
- Guo Y, Ren Y, Zhu L, Yang L, Zheng C. Association between sarcopenia and clinical outcomes in patients with hepatocellular carcinoma: An updated meta-analysis. Sci Rep. 2023;13(1):934.
[Crossref] [Google Scholar] [PubMed]
- Lee YH, Kim SU, Song K, Park JY, Kim DY, Ahn SH, et al. Sarcopenia is associated with significant liver fibrosis independently of obesity and insulin resistance in nonalcoholic fatty liver disease: Nationwide surveys (KNHANES 2008-2011). Hepatology. 2016;63(3):776-786.
[Crossref] [Google Scholar] [PubMed]
- Nishikawa H, Enomoto H, Nishiguchi S, Iijima H. Sarcopenic obesity in liver cirrhosis: Possible mechanism and clinical impact. Int J Mol Sci. 2021;22(4):1917.
[Crossref] [Google Scholar] [PubMed]
- Zambon Azevedo V, Silaghi CA, Maurel T, Silaghi H, Ratziu V, Pais R. Impact of sarcopenia on the severity of the liver damage in patients with non-alcoholic fatty liver disease. Front Nutr. 2021;8:774030.
[Crossref] [Google Scholar] [PubMed]
- Aller de la Fuente R. Nutrition and chronic liver disease. Clin Drug Investig. 2022;42(Suppl 1):55-61.
- Katayama K. Zinc and protein metabolism in chronic liver diseases. Nutr Res. 2020;74:1-9.
[Crossref] [Google Scholar] [PubMed]
- Garbuzenko DV. Pathophysiological mechanisms of hepatic stellate cells activation in liver fibrosis. World J Clin Cases. 2022 Apr 26;10(12):3662-3676.
[Crossref] [Google Scholar] [PubMed]
- Engelke K, Museyko O, Wang L, Laredo JD. Quantitative analysis of skeletal muscle by computed tomography imaging-state of the art. J Orthop Translat. 2018;15:91-103.
[Crossref] [Google Scholar] [PubMed]
- Chen Z, Wang Z, Lohman T, Heymsfield SB, Outwater E, Nicholas JS, et al. Dual-Energy X-Ray Absorptiometry is a valid tool for assessing skeletal muscle mass in older women 1,2. J Nutr. 2007;137(12):2775-2780.
- Derstine BA, Holcombe SA, Ross BE, Wang NC, Su GL, Wang SC. Optimal body size adjustment of L3 CT skeletal muscle area for sarcopenia assessment. Sci Rep. 2021;11(1):279.
[Crossref] [Google Scholar] [PubMed]
- Sergi G, Trevisan C, Veronese N, Lucato P, Manzato E. Imaging of sarcopenia. Eur J Radiol. 2016;85(8):1519-1524.
- Moon SW, Kim SY, Choi JS, Leem AY, Lee SH, Park MS, et al. Thoracic skeletal muscle quantification using computed tomography and prognosis of elderly ICU patients. Sci Rep. 2021;11(1):23461.
[Crossref] [Google Scholar] [PubMed]
Citation: Panke CL, Coral GP, Maeda FK, Suwa E, de Mattos AA, Tovo CV, et al. (2023) Evaluating Sarcopenia in Liver Disease: Assessment of Skeletal Muscle Mass by Computed Tomography is not Related to MASLD by Liver Biopsy. J Clin Res Bioeth. S17:003.
Copyright: © 2023 Panke CL, et al. This is an open-access article distributed under the terms of the Creative Commons Attribution License, which permits unrestricted use, distribution, and reproduction in any medium, provided the original author and source are credited.