

Indexed In
- Academic Journals Database
- Open J Gate
- Genamics JournalSeek
- JournalTOCs
- China National Knowledge Infrastructure (CNKI)
- Scimago
- Ulrich's Periodicals Directory
- RefSeek
- Hamdard University
- EBSCO A-Z
- OCLC- WorldCat
- Publons
- MIAR
- University Grants Commission
- Geneva Foundation for Medical Education and Research
- Euro Pub
- Google Scholar
Useful Links
Share This Page
Open Access Journals
- Agri and Aquaculture
- Biochemistry
- Bioinformatics & Systems Biology
- Business & Management
- Chemistry
- Clinical Sciences
- Engineering
- Food & Nutrition
- General Science
- Genetics & Molecular Biology
- Immunology & Microbiology
- Medical Sciences
- Neuroscience & Psychology
- Nursing & Health Care
- Pharmaceutical Sciences
Research Article - (2021) Volume 0, Issue 0
Effects of Soil and Water Conservation Measures on Plant Species Diversity: Wenago, Southern Regional State, Ethiopia
Mengistu Meresa1*, Menfese Tadesse2 and Negussie Zeray32Wondo Genet College of Forestry and Natural Resources, Hawassa, Ethiopia
3Department of Natural Resources Management, Dilla University, Dilla, Ethiopia
Received: 11-Mar-2021 Published: 02-Apr-2021, DOI: 10.35248/2157-7560.21.s13.001
Abstract
Ethiopia including the study area are faced with deforestation, land degradation, soil erosion problems primarily caused by anthropogenic activities such as clearing vegetation for the purpose of agricultural use, fuel wood, Charcoal, construction and the reaction of conservation measures to restore deforested vegetation is too weak. The aim of the study was to investigate theeffect of Soil and Water Conservation (SWC) measures on plant species diversity by comparing between treated plot areas and non-treated plot areas. The data collection method was mainly drawn through plant measurements, inventory, GPS, household servey, key informant interview, focus group discussion, Office reports. To analyze the collected data, Shannon – wiener diversity index (H1 ) and Sorensen similarity coefficient indices (Is) calculation methods was employed. Based on the interview, direct observation, shannon’s diversity analysis and GPS results, the findings revealed that noticeable vegetation cover and plant species diversity have been observed in treated plot areas than non-treated plot areas in the last 10 years period. This implies that well managed and protected homegardens and area exclosures have better plant species diversity than open grazing fields and communal lands. With these findings, it is rational to conclude that SWC measures have a positive effect on vegetation cover, Plant species diversity, richness and restoration. Thus, it is worth to recommend that conservation priority should be given to the more affected open grazing and communal lands
Keywords
Soil and water conservation measures; Plant species diversity; Sample plots; Measurement; Wenago; Southern regional state; Ethiopia
Introduction
The latest land degradation estimation indicate that out of the 52 million hectares of land making up the highlands of Ethiopia, 14 million hectares are severely degraded, 13 million hectares are moderately degraded and 2 million hectares have practically lost the minimum soil cover needed to produce crops [1]. In Ethiopia the famines of 1973 and 1985 provided an impetus for Soil and Water Conservation (SWC) work through large increase in food aid mainly using imported grains and oil [2]. Following these severe famines, the government of Ethiopia launched an ambitious program of soil and water conservation supported by donor and nongovernmental organizations. The use of food aid as a payment for labor replaced voluntary labor for conservation campaigns. Between 1976 and 1988, soil and stone bunds were constructed on 350,000 ha of cultivated land for terrace formation, and 600,000 ha of steep were closed for regeneration. However, Ethiopia including the the study area (Wenago) is still suffered with land degradation, severe soil erosion, deforestation, agricultural productivity decline and farmers’ low livelihood status mainly due to high population pressure, lack of integrated bio-physical SWC measures, continuous cultivation, miss land use, poor conservation design, low perception of local farmers towards SWC technologies, that affects the physical and biological properties of soils. Therefore, this study was designed to show the contribution of soil and water conservation measures on the recovery of plant species diversity, richness, evenness, similarity and differences by comparing treated and non-treated adjacent plots in the study area.
Literature Review
Rapid deforestation and land degradation problems in Ethiopia
Even though forest resources in Ethiopia have great contribution to economic development, biodiversity conservation and sources of firewood, most of these natural resources are exposed to rapid deforestation and degradation-trend (the deforestation trend-data are given under Table 1. stressed that “historical evidences revealed that a few hundreds ago more than 63% of the total land mass of Ethiopia was covered dense forests but it is not greater than 3% now [3,4] argued that the major causes for the rapid deforestation and land degradation of Ethiopian resources are high population pressure, extensive forest clearing for agricultural use, unwise exploitation of forest for firewood, charcoal and construction materials. According to the current deforestation rate in Ethiopia is estimated to be 160,000-200,000 hectares per year which is extreme shocky [5,6].
Conceptual frame work
Therefore, from the related literatures, data gathered from plant inventory, measurement, interview, personal observation during field survey, and nature of the study environment, a conceptual frame work which shows the complex relationships between each components is developed to analyze the influence of the socioeconomic variables on the plant diversity in the study area (Figure 1).

Figure 1: The conceptual frame work of the study.
Materials and Methods
Location, topography and socio-economic characteristics of the study area
The research was conducted in Wenago, southern regional state (SNNPR), Ethiopia. Geologically, Ethiopia is located between the Equator and Tropic of Cancer and at the North Eastern part of the African continent or what is known as the “Horn of Africa”. Astronomically, Ethiopia is located between 6°20’- 6°32’ N latitude and 38°14’-38°24’E longitude (Figure 2) [7]. The research was conducted in Wenago, some 375 km south of the capital city Addis Ababa. Agro-ecologically Wenago (the study area) is characterized by high land 1978 m a.s.l (25%), midland 1633 m-1978 m (66%), lowland 1633 m (9%) and slopes range from 3.8% to above 50% [8]. The study area has a total population of 152,000 with approximately an area of 248 km2 (24,790 ha) giving a population density of 663 per km2 which is the highest in the country. The study area (Wenago) is regarded as an area for traditional agro forestry system. People of the study area use staple crops such as Enset, Cash crops such as coffee Arabica, fruits and vegetables together. Common tree species such as Millettia Ferruginea (Dhadhatto Birbira), Accacia (Basara Girar), Cardia Africana (Weddessa), PrunusAfricana (Tikur enchet) are also integrated with the crops on the same unit of land used as livestock feed, shading for coffee as well as for settlement of high growing population in the study area [9] (Figure 2) (Supplementary Table 1).

Figure 2: Location of the study area (source: Ethio GIS, 2017).
Sampling design and techniques
Multistage sampling techniques were applied for the study as presented and disscussed below.
Step 1: In the first stage, all the 9 Regional States of Ethiopia were considered to study their agro-ecology, agricultural system, severe soil erosion problems, intervention of SWC activities and socioeconomic characterstics of the people.
Step 2: In the second stage, Southern Regional State which consisted 15 zones and 8 special Districts were selected due to its similar agro-ecology, agricultural system, severe soil erosion problems and active intervention of SWC activities.
Step 3: In the third stage, of the 15 Zones and 8 special Districts of the southern Regional state, wenago District which has 17 rural 4 town kebeles were selected purposively on the basis of its similar agricultural practice, severe deforestation, land degradation, high rate of soil erosion problem and active human SWC intervention.
Method of laying and determining the number of sample plots
To determine and record the composition of plant species diversity, a systematic random sampling was used to locate the sample plots in order to generate plant species diversity, richness and similarity inventory data [10]. The transect lines were laid on the ground starting at one edge of the forest keeping north-south direction. The transected lines were spaced 20 m between and within each parallel lines. At this interval of spacing, sample plots with 20 m × 20 m, 10 m × 10 m, 2 m × 2 m area size were established for trees, saplings and herbs sampling respectively. The sample plots were arranged in concentric manner (Figure 3).

Figure 3: Arrangements of sample plots with nested compartments A, B and C.
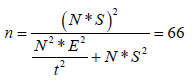
Where, n=number of plots
E=allowed error (0.05)
T=t-test (95% level of confidence)
N=Total area of the layer in (0.24 ha)
S=Standard deviation of the land use system
Therefore, based on the above statically formula, a total of 66 sample plots (in 2,400 m2 area) were determined, of which 11, 22, 11 and 22 sample plots were laid inside the area exclosure, communal land, open grazing land and home garden field respectively for the study (Figure 3).
Vegetation survey method
The height and DBH of woody species were measured using measuring stick and Caliper respectively and the data was recorded in data summary table sheet. For above ground level too large trees the circumferences was measured separately using Tap meter and then the average of the diameter was calculated as
D = C/π
Where D=Diameter;
C=circumference;
π =3.14.
First the recorded data was written in their vernacular name and later converted in to scientific name by the researcher himself using tree database [11]. Sizes of vegetation to be measurd in each compartment for measurement was considerd based on Tirhas Mebrahitu’s (2009) methoed of measurement as all woody species with height >2m and DBH >2.5 cm (compartment A); saplings with height 2<m and DBH<2. 5 cm (compartment B) was recorded and with height <1 cm were taken as seedlings (compartment C) and only their number was estimated.
Plant species diversity data analysis method
Plant species diversity indices were analyzed by using 1) Shannon diversity index (H1) 2) Sorensen similarity coefficient index (Ss) [12,13]. According to these researchers these diversity indices provide important information about species diversity, richness, evenness, rarity and similarity of species in a community. Species richness was the total number of species in the community.
Shannon–wiener diversity index (H1): Shannon diversity index has emerged as the most widely used criterion to assess the conservation potential and ecological values of a given site [14,15]. The two components of diversity combined in the Shannon diversity index are (1) the number of species (abundance) and (2) evenness portion of individuals among the species. The diversity index is the negative sum of all relative abundance multiplied by the natural logarithm of the relative abundance. The Shannon diversity index is calculated based on Kent and Coker (1992) formula as follow
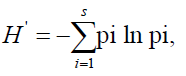
Where, H1=Shannon diversity index;
S=total number of species;
Pi=proportion of individuals found in the ith species;
In=the natural log.
The largest the H1 value, the highest its diversity. Most of the time value of index (H’) lies between 1.5 and 3.5 [16,17]. Evenness (E’) is the ratio of H’ to natural log of species richness.
E=H’/In S.
Where, E=Evenness;
S=species richness.
E has values between 0 and 1, 1 represents a situation in which all species are equally abundant the sample study plot. In the study area the species diversity in the conserved and non-conserved sites was calculated using index. For species richness data, chi-square test was employed, for diversity index ANOVA was used whereas, to compare the diversity and richness of trees, shrubs and herbs paired sample test was used.
Sorensen similarity coefficient indices (Is): To analyze the presence and absence of plant species between the two adjacent plots, Incidence-based measures of similarity are the most important method [18]. The degree of similarity (overlap) between any communities will be expressed mathematically on the basis of quantitative (frequency). Sorensen coefficient similarity (Is) is applied because it gives a weight to the species that are common to the samples rather than to these that only occur in either sample. The Index of Sorensen coefficient similarity (Is) will be estimated using the formula proposed by Sorenson’s similarity index (1948) [19-21].
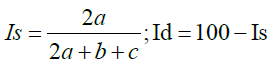
Where, Is=Sorenson similarity coefficient index
Id=Sorenson difference coefficient index
a=no of species common to both conserved and non-conserved plots
b=no of species present in conserved plot but absent in nonconserved plot
c=no of species present in non-conserved plot but absent in conserved plot
Therefore, using these Shannon – wiener diversity index (H1) and Sorenson similarity coefficient indices (Is), plant species diversity, richness, evenness and similarity in comparing of conserved and non-conserved areas were analyzed.
Results and Discussion
The best SWC technologies practiced and identified in the study area
The common forms soil and water conservation measures identified in the study area are: stone terraces, soil bunds, stenches, hillside terracing, grass strip, traditional cut- off drain, contour ploughing, agro forestry, and area exclosures (Figures 4A-4F).

Figure 4: The major forms of land management systems and SWC measures practiced in the study area (Source: field survey, and Photographs by the researcher, 2020). (A) Agroforestry (B) Area exclosure (C) Stone terraces at communal land (D) Stone terraces at hillside (E) Soil bund (F) Soil strench.
Adoption trend-curve of SWC technologies area (m2) in the study area (2010-2019)
In the study area adoption rates of SWC technologies were implemented in different years with different SWC areas of construction (m2). The result of adoption curve for soil and water conservation technologies (m2) showed that it was raised gradually from 2010 up to 2013 but declined from 2013 to 2015 might be due to shortage of fund or other factors while the conservation technologies (m2) steadily and progressively increases from 2015 to 2019 mostly could be due to fund availability, strong institutional structure, good management system, high awareness of local farmers, effective support of experts and favorable climatic condition in these time of SWC implementation years (Figure 5).

Figure 5: Adoption trend-curve of SWC technologies in the last 10 years (2010-2019). (Source: Wonago Agriculture and Natural resources Office, 2018).
Plant species composition
The result indicated that a total of 35 plant species belonging to 25 families were identified in the three study sites known as kebeles. Among the 35 identified plant species, 16(45.7%) were found in Home garden, 10 (28.5%) in woodlot, 5(14.2%) in crop field and 4(11.4%) in grazing land. The result of the study showed that out of the total 35 identified plant species, woody species shared 20(57.2%), shrub species 11(31.4%), and the rest herbs were classified as 4(11.4%) (source: own survey result listed in Supplementary Table 1 (2019/20). In addition to this, there were other serious results measured and identified in conserved and adjacent non-conserved plots. Based on this result, a total of all the 35 plant species (47.9%) were identified in the conserved plot, 19(26%) were identified in the adjacent non-conserved plot and 19(26%) plant species were also found common to both conserved and non-conserved plots in the study site [22-24]. Of the total 35 identified plant species 28(80%) were native (indigenous) to the study area and the rest 7(20%) were found as non-native (Supplementary Table 1).
| Type | 1994 | 1995 | 1996 | 1997 | 1998 | 1999 | 2000 | 2001 | 2005 | 2010 |
|---|---|---|---|---|---|---|---|---|---|---|
| Natural forest | 399295 | 247716 | 231813 | 211597 | 217803 | 218764 | 223777 | 254668 | 255213 | 271249 |
Source: Ministry of Agriculture and Rural Development (2004); EPA (2004); Ethiopia forest information and data (2011) and Eshetu (2014)
Table 1: Trend of deforestation estimates in Ethiopia (in hectare) 1994-2010 E.C.
The study plots were held and measured in area Exclosures, Farm fields, communal land and open grazing sites. The most dominant plant species recorded in the farm land plot were Coffee Arabica L. and Millettia ferruginea (Hochst.) baker .Sharing 19.6% and 6.4% respectively. On the other hand the most dominant plant species recorded in the conserved plot (area Exclosure) were Juniperus procera hochst ex endl. and Acacia saligna (Labill.) syn.A. mollisima represented by 8.9% and 4.7% respectively. On the open Grazing land the most dominant plant species was Cynodon dactylon (L.) pers. Followed by Casuarina cunninghamiana Miq having 5.1% and 3.8% respectively (Supplementary Table 1). From this analysis of vegetation composition, we can concluded that improved species composition status was recorded in the farm field and area Exclosures over that of open-Grazing land. This difference might have resulted from the effect of human home Garden and area Exclosures management that help the biological and physical factors to create conducive environment to sustain those plant species with fast recovering ability in the highly disturbed areas. This clearly indicated that the open Grazing land consists of fewer vegetation compositions when it is compared with that of conserved area Exclosures and well managed farm fields [25-27].
Similarily, as we have discussed earlier, the study identified 35 plant species diversity, of which 8 (22.8%) are used for traditional medicine purpose (the lists are provided in Supplementary Table 1). In the study area plants used as a source of income and medicine health care which are collected from wild natural vegetation and agricultural farm lands. The information gained from the respondents and direct filed observation showed that traditional management practices play a significant role in conservation of plant species including medicinal plants because these practices are closely linked to local cultural beliefs (locally known as Geda and Shengo systems in the study communities. However, deforestation and over exploitation are still the major threating factors of these plants [28]. Therefore, the author stressed the need for more attention to traditional knowledge of conservation which could be more important in this generation and may serve as a string-board for scientific innovation in the future.
Plant species richness, diversity index and evenness
In the study area to generate plant species information, data were collected from the survey and entered into a computer (Microsoft Excel). After all important data were entered in to Excel, Species richness (S) i.e. the total number of species, Shannon’s Wiener (1949) diversity index (H’) and species Evenness (E) were computed for the treated and non-treated sample plots of each sample site were and the result was indicated in Table 2 and Figure 6. In terms of sampled sites comparison, the highest species diversity was recorded in Dobota site (2.338) followed by Tumata chirecha site (2.220) and Kara soditi (2.209) and the evenness index of species ranged between 0.715 and 0.967 [29,30].
| Study sites/plots | Species richness(S) (The total number of species) | Species diversity (H’) (H’=-?pi*lnpi) | Species evenness(E) (E=H’/Ln(S) | H’ | p- value | |
|---|---|---|---|---|---|---|
| Tumata chirecha site | 11 | 2.22 | 0.926 | |||
| Conserved plot (Homegarden) | 11 | 2.405 | 1.003 | 2.405 ± 1.332 | ** | |
| Non-conserved plot(communal land) | 4 | 1.332 | 0.961 | |||
| Kara soditi site | 12 | 2.209 | 0.889 | |||
| Conserved plot (area exclosure) | 12 | 2.156 | 0.867 | 2.156 ± 1.646 | ** | |
| Non-conserved plot (grazing land) | 10 | 1.646 | 0.715 | |||
| Dobota site | 15 | 2.338 | 0.863 | |||
| Conserved plot (Homegarden) | 15 | 2.62 | 0.967 | 2,62 ± 1.668 | ** | |
| Non-conservedplot (communal land) | 6 | 1.668 | 0.931 | |||
Source: Field survey, 2020.
Table 2: Responses of plant Species richness (S), Evenness (E) and Shannon Wiener diversity index(H’) for the conserved and non-conserved of the three
sites.
When we compare the species diversity index between treated (area exclosure and Home garden) and non-treated (open grazing field and communal land) the result revealed that Shannon’s diversity index for area exclosure, home garden, open grazing field and communal land was recorded as 1.680, 1.484, 0.970 and 0.637 respectively which indicating that area exclosures and home garden has larger species diversity than open grazing and communal lands (Tables 3 and 4). Similarly, species were rich in the area exclosure and home garden as compared to open grazing and communal land. The overall species evenness for the area exclosure and home garden is represented by larger numbers of individual plants. This result showed a successful restoration of plant species diversity and richness in area exclosure and home garden compared to those of non-treated open grazing and communal lands. This result is in line with the finding [31-33].
| Name of study sites | Plant forms | On conserved area | On non-conserved area | ||||
|---|---|---|---|---|---|---|---|
| Species richness(S) (The total number of species) | Species diversity (H’) (H’=-?pi*lnpi) | Species evenness (E) (E=H’/Ln(S) | Species richness(S) (The total number of species) | Species diversity(H’) (H’= -?pi*lnpi) | Species evenness (E) (E=H’/Ln(S) | ||
| Tumata chericha | Trees | 5 | 1.484 | 0.922 | 2 | 0.635 | 0.916 |
| Shrubs | 5 | 1.385 | 0.86 | 1 | 0 | 0 | |
| Herbs | 1 | 0 | 0 | 1 | 0 | 0 | |
| Kara Soditi | Trees | 9 | 1.68 | 0.764 | 7 | 1.883 | 0.942 |
| Shrubs | 3 | 0.931 | 0.847 | 3 | 0.948 | 0.863 | |
| Herbs | 0 | 0 | 0 | 0 | 0 | 0 | |
| Dobota | Trees | 8 | 1.976 | 0.95 | 3 | 1.038 | 0.945 |
| Shrubs | 4 | 0.667 | 0.481 | 1 | 0 | 0 | |
| Herbs | 3 | 0.801 | 0.729 | 2 | 0.635 | 0.916 | |
Source: field survey, 2020.
Table 3: Responses of plat growth forms in terms of plant species richness, diversity index and evenness by comparison of conserved and non-conserved selected sample sites.
| Life forms | Land uses being compared | Diversity indices | p-value | |||
|---|---|---|---|---|---|---|
| Tumata chirecha site | H’ | E | H’ | E | ||
| Trees | Homegarden Vs. communal | 1.484 ± 0.635 | 0.922 ± 0.916 | ** | ns | |
| Shrubs | Homegarden Vs. communal | 1.385 ± 0 | 0.860 ± 0 | ** | ** | |
| Herbs | Homegarden Vs. communal | 0 ± 0 | 0 ± 0 | ns | ns | |
| Kara soditi site | ||||||
| Trees | Exclosure Vs. open grazing | 1.680 ± 1.883 | 0.764 ± 0.942 | ** | ** | |
| Shrubs | Exclosure Vs. open grazing | 0.931 ± 0.948 | 0.847 ± 0.863 | ns | ns | |
| Herbs | Exclosure Vs. open grazing | 0 ± 0 | 0 ± 0 | ns | ns | |
| Dobota site | ||||||
| Trees | Homegarden Vs. communal | 1.976 ± 1.038 | 0.950 ± 0.945 | ** | ns | |
| Shrubs | Homegarden Vs. communal | 0.667 ± 0 | 0.481 ± 0 | ** | ** | |
| Herbs | Homegarden Vs. communal | 0.801 ± 0.635 | 0.729 ± 0.916 | ** | ** | |
| Summarized diversity indices in the study area | ||||||
| Diversity indices | Homegarden Vs. communal land | Area exclosure Vs. Open grazing | ||||
| Trees | 1.484 ± 0.633** | 1.680 ± 1.88** | ||||
| Shrubs | 0.657 ± 0** | 0.931 ± 0.947 Ns | ||||
| Herbs | 0.801 ± 0.634** | 0 ± 0 Ns | ||||
Source: Own survey result, 2020. **p<0.05; Ns>0.05
Table 4: Comparison of diversity indices among the open grazing, communal land, homegarden and area exclosures land uses for trees, shrubs and herbs.
The diversity indices among the growth form illustrated in Figure 6 clearly revealed that the effect of open, closed and well managed on the diversity of the trees, shrubs and herbs is different. The result of shrubs and herbs species rises gradually and be dominant from open grazing to up to the communal land mostly could be due to deforestation of trees diversity by human intervention but herbs start to decline in the home garden and area exclosure while the diversity of trees steadily and progressively increases from home garden up to area exclosure (Figure 6). The step decline for herbaceous diversity while trees diversity getting higher in the home garden particularly in area exclosure might be due to competition of light, inverse interaction between trees and herbs as well as good management system. During the key informant interview and focus group discussion, the household respondents also confirmed that grass production which is useful for livestock feed in the area exclosure has been declining from year to year. Their perception was in line with the argument of the study that could be due to sun light and moisture competition between grass-trees balance [34].

Figure 6: Diversity indices among the open grazing, communal land, home garden and area exclosures land uses for trees, shrubs and herbs. (Source: Own survey result, 2020).
Sorenson species similarity and difference index (%)
Similarity index between the three sample sites and among the treated and non-treated land uses were compared according to Sorenson’s index (1948) method considering the presence/absence of species within land uses. Accordingly, the result revealed that 0.976, 0.852, 0.471 and 0.543 was found in area exclosure, home garden, open grazing and communal land with coefficient index differences 0.412, 0.450, 0.660 and 0.690 respectively which indicating that treated land uses (area exclosure and home garden) have high species diversity compared to non-treated land uses (open grazing and communal land).
Implication for forest conservation
Improve forests management system to improve forest quality: Forest management should focus on avoiding further encroachment and internal degradation of the forest by controlling tree cutting, over exploitation and grazing [35-37]. Accordingly, increasing tree cover in and around the area in which communities live through locally sound agro forestry practices can contribute to local livelihood and assist in conserving biodiversity within the forest itself. Thus, forest management has to be supported by environmental education, community-based monitoring and other forms of public management required for conservation planning for multiple stakeholders.
Improve policy to conserve forests: Proving legislative instrument or institutions that strengthen conservation and management of forests by governmental institutions and other local-based rules could strengthen Ethiopia’s forest conservation strategy in general and the study area in particular. The policies should aim to strengthen, not replace, local forms of forest protection [38]. This implies that creating a good institution is important to integrate the effectiveness of sustainable conservation and innovation in to the local government assessment system, high lithing the government’s policy guidance and enabling government policies to play their due role. (Moreover, environmental regulations should in accordance with local conditions, culture and interest of communities [39-41].
Contribution of forest management to local livelihood: Even though collecting products from the area exclosure is not considered as one of the main livelihood strategies in the study area, it is considered by the household head respondents that it has a significant contribution in extracting grass, fire wood, medicinal plants and area earning incomes from sale of these products which supports their subsistence livelihoods. During the focus group discussion, 75% of the households raised a wonderful idea that most of the time poor households involved in the area exclosure products collection because the poor family need to diversify their incomes when sufficient agricultural products are not be available in their house. The remaining 25% of respondents also added that rich households engaged in this collection activity in a very limited manner [42,43].
In addition to this economic value, plant species diversity has also a traditional medicinal value to treat human. The information gained from the household head respondents showed that traditional vegetation management practices play a significant role in conservation of plant species including medicinal plants because these practices are closely linked to local cultural beliefs (locally known as Geda and Shengo systems in the study communities. For instance, based on the information gathered during the key informant interview, medicinal plant knowledge acquisition by the healer individuals was from parents, local elders and by self-trial and error method (without scientific measurement and dose). The local communities used these medicinal plants mainly to treat, Malaria, cough, fever, headache, diarrhea and intestinal parasites.
Informant farmers were also asked to reflect their opinion on the real condition of forests management syetem. Accordingly, 99% of the respondents explained that conservation of forests and plant species diversity is very important interms of local and regional economy. However, 1% of the participants responded that conservation of forests and vegetations is not good because of the increase of wild animals like hyena, leopaed, fox and roddents become a problem in killing their domestic animals.
Citation: Meresa M, Tadesse M, Zeray N (2021) Effects of Soil and Water Conservation Measures on Plant Species Diversity: Wenago, Southern Regional State, Ethiopia. J Vaccines Vaccin S13:001.
Copyright: © 2021 Meresa M, et al. This is an open-access article distributed under the terms of the Creative Commons Attribution License, which permits unrestricted use, distribution, and reproduction in any medium, provided the original author and source are credited.