Indexed In
- Academic Journals Database
- Open J Gate
- Genamics JournalSeek
- JournalTOCs
- China National Knowledge Infrastructure (CNKI)
- Scimago
- Ulrich's Periodicals Directory
- RefSeek
- Hamdard University
- EBSCO A-Z
- OCLC- WorldCat
- Publons
- MIAR
- University Grants Commission
- Geneva Foundation for Medical Education and Research
- Euro Pub
- Google Scholar
Useful Links
Share This Page
Open Access Journals
- Agri and Aquaculture
- Biochemistry
- Bioinformatics & Systems Biology
- Business & Management
- Chemistry
- Clinical Sciences
- Engineering
- Food & Nutrition
- General Science
- Genetics & Molecular Biology
- Immunology & Microbiology
- Medical Sciences
- Neuroscience & Psychology
- Nursing & Health Care
- Pharmaceutical Sciences
Research Article - (2024) Volume 0, Issue 0
Effect of the Mass Vaccination Duration on the Spread of COVID-19-Evaluated by a Flexible Compartment Model
Hiroo Ohmori*Received: 15-Jan-2024, Manuscript No. JVV-24-24634; Editor assigned: 18-Jan-2024, Pre QC No. JVV-24-24634 (PQ); Reviewed: 01-Feb-2024, QC No. JVV-24-24634; Revised: 08-Feb-2024, Manuscript No. JVV-24-24634 (R); Published: 15-Feb-2024, DOI: 10.35248/2157-7560.15.S25.002
Abstract
For COVID-19, infected individuals are isolated from the community when they become symptomatic, and when they become recovered individuals who have immunity, they return to the community. With an increase in the number of recovered individuals in the community, the contact rate between infected individuals and susceptible individuals decreases, resulting in a decrease in the number of infected individuals. Vaccination causes not only a decrease in the number of susceptible individuals in the community but also a reduction in the contact rate between infected individuals and susceptible individuals with an increase in the number of vaccinated individuals, as does the number of recovered individuals. Namely, the total number of vaccinated individuals strongly controls the spread of COVID-19. From the viewpoint of herd immunity, the vaccination duration, which is the period between the start and the end of mass vaccination, must be examined because the number of vaccinated individuals actually increases gradually daily according to vaccination programs, and the total number of vaccinated individuals depends on the duration of mass vaccination. How long should we continue mass vaccination to contain the COVID-19 pandemic from a physical viewpoint? The number of individuals infected according to different durations of mass vaccination was calculated by a flexible compartment model specific to COVID-19. The model contains the vaccination rate as an independent variable in the calculation equations and, as the dependent variable, the number of isolated/ recovered individuals and the population excluding the individuals kept in isolation, both of which affect the contact rate between infected individuals and susceptible individuals. The effect of the duration of mass vaccination can be evaluated by comparing the total number of infected individuals among those calculated according to different durations of mass vaccination in the cases with different start dates of vaccination and/or with different vaccination rates and/or with different symptomatic rates. The results show that since the contact rate decreases with an increase in the number of vaccinated individuals, the earlier the start date of vaccination is, the smaller the total number of infected individuals becomes, and the longer the mass vaccination duration is, the smaller the total number of infected individuals becomes. The results also showed that when vaccination is continued until the day when the sum of the number of recovered individuals and the number of vaccinated individuals exceeds an ‘expedient herd immunity threshold’, the total number of infected individuals is significantly reduced, and the duration of infection is also markedly shortened, as expected in the case with a sufficient duration of mass vaccination.
Keywords
Asymptomatic; Compartment model; COVID-19; Duration of infection; Herd immunity; Infected; Infection during the latent period; Isolation; SIR model; Recovered; Susceptible; Symptomatic rate; Mass vaccination duration
Introduction
Individuals infected with COVID-19 should be isolated from the community when they become symptomatic after the latent period ends, and when the isolation period ends, they become the ‘recovered’ individuals who have immunity and then return to the community. In a community mixed with infected individuals, susceptible individuals and recovered individuals, the contact rate between infected individuals and susceptible individuals is reduced by the contact of infected individuals with recovered individuals when the number of recovered individuals increases, resulting in a decrease in the number of infected individuals.
On the other hand, vaccination causes not only a decrease in the number of susceptible individuals in the community but also an increase in the number of individuals who are resistant to COVID-19 infection. Since vaccinated individuals live and work in the community, they cause a reduction in the contact rate between infected individuals and susceptible individuals, similar to that of recovered individuals. Therefore, the total number of vaccinated individuals practically/strongly controls the spread of COVID-19 [1,2].
The duration of vaccination for COVID-19 has been discussed in terms of the extent to which vaccines are effective [3-9]. For the protection effect/prevention effect (effectiveness against symptomatic COVID-19)/effectiveness against hospitalization (protection effect against severe disease), different durations are reported for different vaccines and/or for different ages of infected individuals; for example, “the vaccine effectiveness persists/ decreases by 1 month and/or 6 months”.
From the viewpoint of herd immunity to contain the COVID-19 pandemic, however, the duration of mass vaccination, which is not the vaccination interval, for example, the period between the primary vaccination and the booster dose but rather the period between the start and the end of mass vaccination, must be examined because the total number of vaccinated individuals, which practically controls the spread of COVID-19, depends on the duration of mass vaccination. Namely, the total number of vaccinated individuals is practically determined by the mass vaccination duration because the number of vaccinated individuals actually increases gradually day by day even for a successful vaccination process, as there is a limit on the number of individuals vaccinated a day for any community due to the limit of the supply of vaccines and vaccinators (staff and equipment) and, as noted by Fan et al. [10], practically due to staff turnover in mass vaccination centers and others.
Although “when and which control measures can be relaxed during the rollout of vaccination programmes” was discussed even at the beginning of the COVID-19 pandemic by Viana et al. [11], the study was performed on the basis of an extended age-stratified SARS-CoV-2 transmission model, which is an extended model of the SIR model created by Kermack and McKendrick [12,13]. For the SIR model and its extended model, the ‘recovered’ individuals were removed not only from the disease but also from the community. They do not return to the community. Therefore, the effect of the recovered individuals reducing the contact rate between infected individuals and susceptible individuals was not included in the calculation processes, and the reduction effect of the vaccinated individuals on the contact rate was excluded. The dynamics of the ‘contact rate’ are the physical basis of the spread of COVID-19.
The model used here for calculating the number of infected individuals is the flexible compartment model specific to COVID-19 proposed by Ohmori [1]. Since the vaccination rate is an independent variable in the calculation equations, the number of vaccinated individuals can be calculated. The model also contains, as dependent variables, the number of isolated/recovered individuals and the population excluding the individuals kept in isolation, both of which change through the course of infection and affect the contact rate between infected individuals and susceptible individuals. The number of infected individuals was calculated according to the duration of mass vaccination. The effect of the duration of mass vaccination can be evaluated by comparing the total number of infected individuals among those calculated for different durations of mass vaccination in the cases with different start dates and end dates of vaccination and/or with different vaccination rates and/or with different symptomatic rates. The evaluation of the effect of the duration of mass vaccination could provide reference materials for medical and/or political measures.
Framework of the flexible compartment model used
The flexible compartment model proposed by Ohmori [1] consists of six categories: ‘susceptible (remainder): RM’; ‘vaccinated: V’; ‘recovered: RI, RT, RAS’; ‘infected (‘infectious’, ‘patient’): P’; ‘isolated: I, PI’; and ‘death: DAS, DTI, DT’, as shown in Figure 1. ‘Susceptible’ is the number of susceptible individuals who are not infected but could become infected. ‘Vaccinated’ is the number of vaccinated individuals who have been vaccinated, who have immunity and who live and work in the real community, as shown in Figure 1. ‘Recovered’ is the number of individuals who were isolated from the real community to the isolation community when they were symptomatic after the end of the latent period, had recovered from the disease and had immunity after the infectious period (the recovery period) ended and then returned to the real community. ‘Infected’ is the number of infected individuals who have been infected and are capable of infecting susceptible individuals. ‘Isolated’ is the number of individuals kept in isolation, which means the number of infected individuals who have been isolated, kept in the ‘isolation community’ until the recovery period ends, and then become recovered individuals who have immunity. ‘Death’ is the number of individuals who died of infection after the latent period, that is, the death toll.
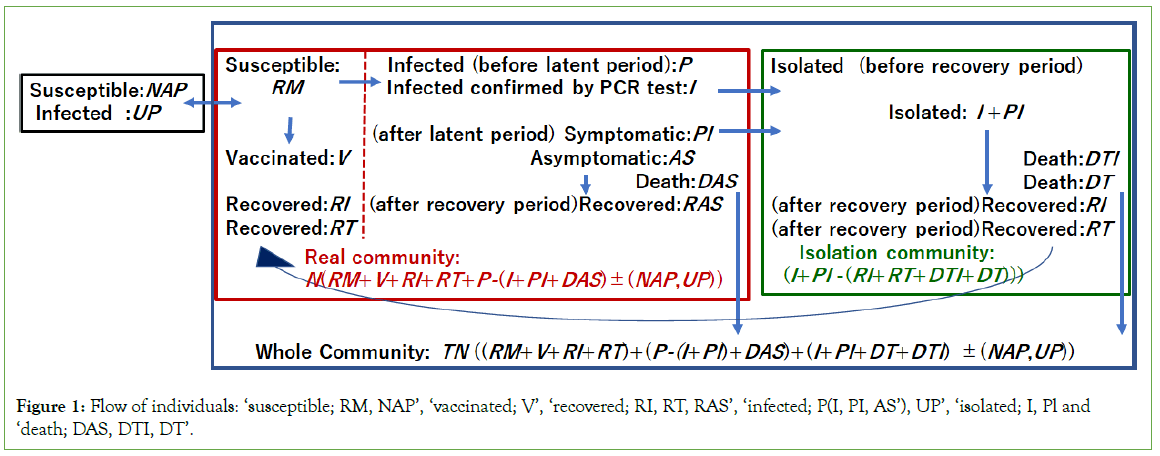
Figure 1: Flow of individuals: ‘susceptible; RM, NAP’, ‘vaccinated; V’, ‘recovered; RI, RT, RAS’, ‘infected; P(I, PI, AS’), UP’, ‘isolated; I, Pl and ‘death; DAS, DTI, DT’.
The compartment on the left side, containing ‘susceptible’, ‘vaccinated’, ‘recovered’, ‘infected’ and ‘death’, is the ‘real community’. Its population, N, is changed by subtracting the number of isolated individuals (I,PI) and death (DAS) and by adding the number of recovered individuals (RI,RT). Another compartment on the right side, containing ‘isolated’, ‘recovered’ and ‘death’, is the ‘isolation community’, whose population, that is, the number of individuals kept in isolation, is also changed by subtracting the number of recovered individuals (RI,RT) returning to the real community and of the death (DTI, DT). The large compartment consisting of the two compartments mentioned above is the ‘whole community’, the population of which is referred to as TN(n). TN(n) includes the number of individuals living in the two compartments and the toll of death (DAS, DTI, DT) occurring at the fatality rate in the two compartments. TN(n) and N(n) are changed due to the number of ‘susceptible (NAP(n))’ and/or ‘infected (UP(n))’ individuals coming in and/or going out of the community. As shown above, each compartment contains individuals belonging to different categories, and its population changes by interacting with another compartment and with the outside.
The infected individuals in the community, P(n), were separated into three groups: those (I(n)) who were confirmed to be infected due to being test positive, those (PI(n)) who became symptomatic after the latent period and those (AS(n)) who were asymptomatic through the recovery period. The isolated individuals were divided into two groups: those (I(n)) who were confirmed to be infected due to being test positive and then isolated and those (PI(n)) who became symptomatic in the community and then isolated. Each of these parameters needs to be calculated in a different manner according to the coefficients of the test positive rate and the symptomatic rate.
The recovered individuals were divided into two groups: One group included individuals in the right compartment, namely, those (RI(n’)) who were isolated due to being test positive (I(n)) and had recovered and those (RT(n’)) who were isolated due to being symptomatic in the community (PI(n)) and had recovered. The recovered individuals were to return to the community after the isolation period ended. The date (n’) of returning to the community must be calculated in a different manner according to the duration of isolation. The total number of these recovered individuals (RI(n’)+RT(n’)) is not always equal to that of infected individuals (I(n)+PI(n)) because RI(n’)+RT(n’) is the number obtained by subtracting the total number of deaths (DTI(n)+DT(n)) from (I(n)+PI(n). The other group included individuals who recovered from asymptomatic disease in the left compartment (RAS(n’); they were not isolated remained in the community and recovered from the disease after the recovery period. The number of recovered individuals (RAS(n’)) is not always equal to the number of asymptomatic infected individuals (AS(n)) because RAS(n’) is the number after subtracting the number of deaths (DAS(n) from AS(n)).
Individuals who died (death) were also divided into two groups: those (DAS(n)) who were asymptomatic and died from infection after the latent period in the community and those (DTI(n) and DT(n)) who died during the isolation period. Each of these variables needs to be calculated in a different manner according to the fatality rate. The vaccinated individuals, V(n), have immunity and live and work in the community. Vaccination decreases the number of susceptible individuals and reduces the contact rate between infected individuals and susceptible individuals.
Calculation process of the flexible compartment model
Contact rate in the community mixed with infected, susceptible, recovered and vaccinated individuals: Contact between infected individuals and susceptible individuals can cause infections. It actually occurs in a community mixed with infected, susceptible and recovered individuals. Thus, infected individuals contact not only susceptible individuals but also recovered individuals. From a physical point of view, contact between infected individuals and recovered individuals must reduce the contact rate between infected individuals and susceptible individuals when the number of recovered individuals increases. Accounting for the reduction effect of the number of recovered individuals on the contact rate, the contact rate should be given by the following equation 1:
cr(n)=(S(n)/N(n))(1- δ (R(n)/N(n))) (1)
where ‘cr(n)’ is the contact rate, n is the date starting from equation 1 when the infection begins, S(n) is the number of susceptible individuals in the community, R(n) is the number of recovered individuals who returned to the community from isolation, and N(n) is the population that includes susceptible individuals, vaccinated individuals, infected individuals who are not yet isolated and recovered individuals who returned to the real community from the isolation community but excluding individuals who are kept in isolation and dead individuals. The term ‘-δ(R(n)/N(n))’ is the reduction effect of the recovered individuals on the contact rate between infected individuals and susceptible individuals, and the term ‘1-δ(R(n)/N(n)’ is the ‘reduction rate’ of the contact rate. The reduction effect increases with decreasing value of (1-δ(R(n)/N(n)), indicating that the contact rate decreases with increasing number of recovered individuals (Table 1 and Figure 2). ‘δ’ is a coefficient expressing the activity level of the recovered individuals living in the community. When the value of δ is given by 1, the activity is the same as that of the susceptible individuals, and when the value of δ is given by 0, the recovered individuals are not active, meaning a similar condition as they are kept in isolation, although the number of recovered individuals is added to the population.
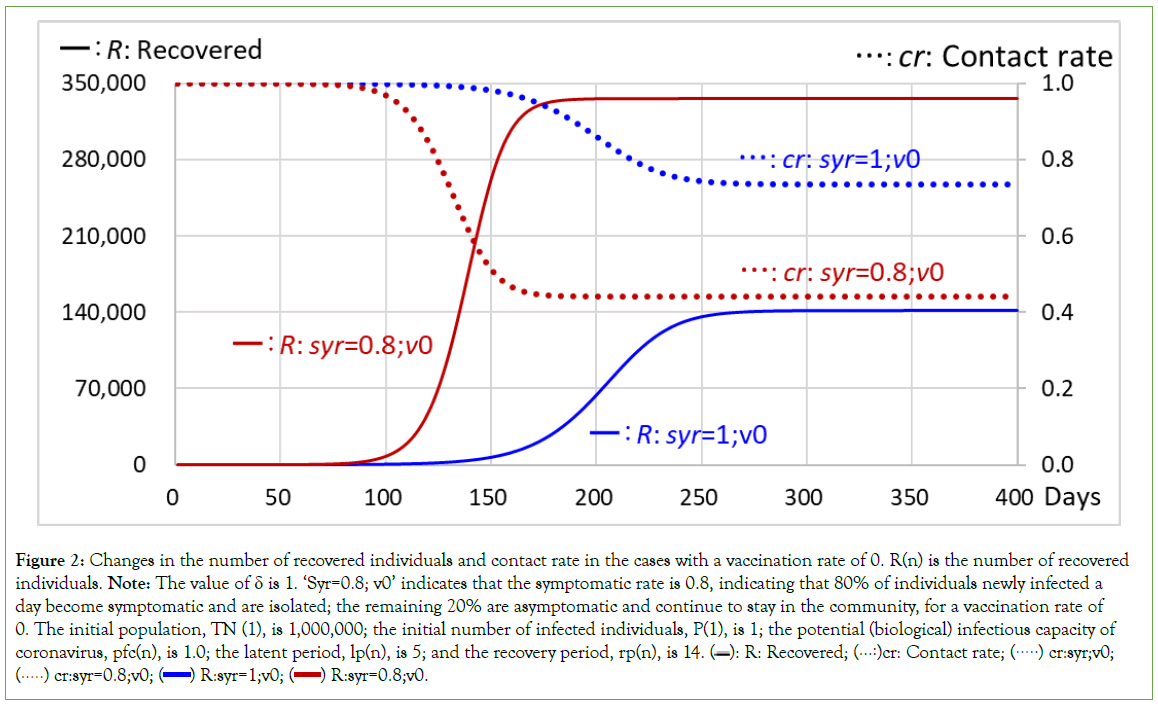
Figure 2: Changes in the number of recovered individuals and contact rate in the cases with a vaccination rate of 0. R(n) is the number of recovered individuals. Note: The value of δ is 1. ‘Syr=0.8; v0’ indicates that the symptomatic rate is 0.8, indicating that 80% of individuals newly infected a day become symptomatic and are isolated; the remaining 20% are asymptomatic and continue to stay in the community, for a vaccination rate of 0. The initial population, TN (1), is 1,000,000; the initial number of infected individuals, P(1), is 1; the potential (biological) infectious capacity of coronavirus, pfc(n), is 1.0; the latent period, lp(n), is 5; and the recovery period, rp(n), is 14.  cr:syr;v0;
  R:syr=0.8;v0.
| Time | syr(n)=1;v(n)0 | syr(n)=1,v(101-)0.001 | syr(n)=1,v(151-)0.001 | syr(n)=1,v(201-)0.001 | syr(n)=0.8;v(n)0 | ||||||||
|---|---|---|---|---|---|---|---|---|---|---|---|---|---|
| n | R(n) | cr(n) | V(n) | R(n)+V(n) | cr(n) | V(n) | R(n)+V(n) | cr(n) | V(n) | R(n)+V(n) | cr(n) | R(n) | cr(n) |
| 50 | 30 | 1 | 0 | 30 | 1 | 0 | 30 | 1 | 0 | 30 | 1 | 66 | 1 |
| 100 | 500 | 1 | 0 | 500 | 1 | 0 | 500 | 1 | 0 | 500 | 1 | 7930 | 0.97 |
| 150 | 6,965 | 0.98 | 50000 | 55531 | 0.89 | 0 | 6965 | 0.98 | 0 | 6965 | 0.98 | 262572 | 0.51 |
| 200 | 64,266 | 0.86 | 100000 | 115115 | 0.78 | 50000 | 103800 | 0.8 | 0 | 64266 | 0.86 | 335,892 | 0.44 |
| 250 | 136014 | 0.74 | 150000 | 167197 | 0.69 | 100000 | 178148 | 0.68 | 50000 | 181125 | 0.67 | 336,096 | 0.44 |
| 300 | 141,652 | 0.74 | 200000 | 217247 | 0.61 | 150000 | 228625 | 0.6 | 100000 | 233195 | 0.59 | 336,096 | 0.44 |
| 350 | 141,785 | 0.74 | 250000 | 267247 | 0.54 | 200000 | 278625 | 0.52 | 150000 | 233198 | 0.51 | 336,096 | 0.44 |
| 400 | 141,785 | 0.74 | 300000 | 317247 | 0.47 | 250000 | 328625 | 0.45 | 200000 | 333198 | 0.44 | 336,096 | 0.44 |
Table 1: Changes in the sum of the number of recovered individuals and the number of vaccinated individuals, R(n)+V(n), and in the contact rate, cr (n), by different start dates of vaccination. R(n) is the number of recovered individuals, and V(n) is the number of vaccinated individuals. Note: v(101-)0.001 indicates that vaccination at a rate of 0.001 starts on the 101st day, and the vaccination rate increases by 0.001 a day to the end of simulation, indicating that the number of vaccinated individuals increases by 1,000 a day on and after the 101st day. ‘Syr=0.8; v0’ means that the symptomatic rate is 0.8 and the vaccination rate is 0. The value of δ is 1, that is, alI(n)=1 and alV(n)=1. The initial population, TN(1), is 1,000,000; the initial number of infected individuals, P(1), is 1; the potential (biological) infectious capacity of coronavirus, pfc(n), is 1.0; the latent period, lp(n), is 5; and the recovery period, rp(n), is 14.
The reduction in the contact rate is caused not only by the recovered individuals but also by the vaccinated individuals who have been vaccinated, have immunity and are living and working in the community. The reduction effect of vaccination should be taken into account in the simulation, as expressed by Equation (1’).
cr(n)=(S(n)/N(n))* (1-(alI(n)* CRT(n)+alV(n)*V(n))/N(n)) ………(1’)
where, CRT(n)=ΣRT(n) and RT(n) is the number of recovered individuals who were once isolated due to being symptomatic and had returned to the community when the isolation period ended, and the coefficient alI (n) is the activity level of the recovered individuals who returned to the community from isolation. V(n) is the number of vaccinated individuals who have immunity and are living and working in the community, and alV (n) is the activity level of the vaccinated individuals. The ‘(alI(n)* CRT(n)+alV(n)*V(n))’ conceptually refers to the sum of the number of recovered individuals and the number of vaccinated individuals, and ‘(1-(alI(n)* CRT(n)+alV(n)*V(n))’ is equivalent to (1-δ(R(n)) of Equation (1). This contact rate, cr(n), expressed in Equation (1’), is used for the calculation of the number of infected individuals, as shown by Equation (2), which includes the effect of the recovered individuals who recovered from the asymptomatic category in the community, CRAS(n). The contact rate decreases with an increase in trial time (days) induced by an increase in the sum of the number of recovered individuals and the number of vaccinated individuals, R+V (Table 1 and Figure 3), although the contact rate is the same for the same value of R+V (Figure 4).
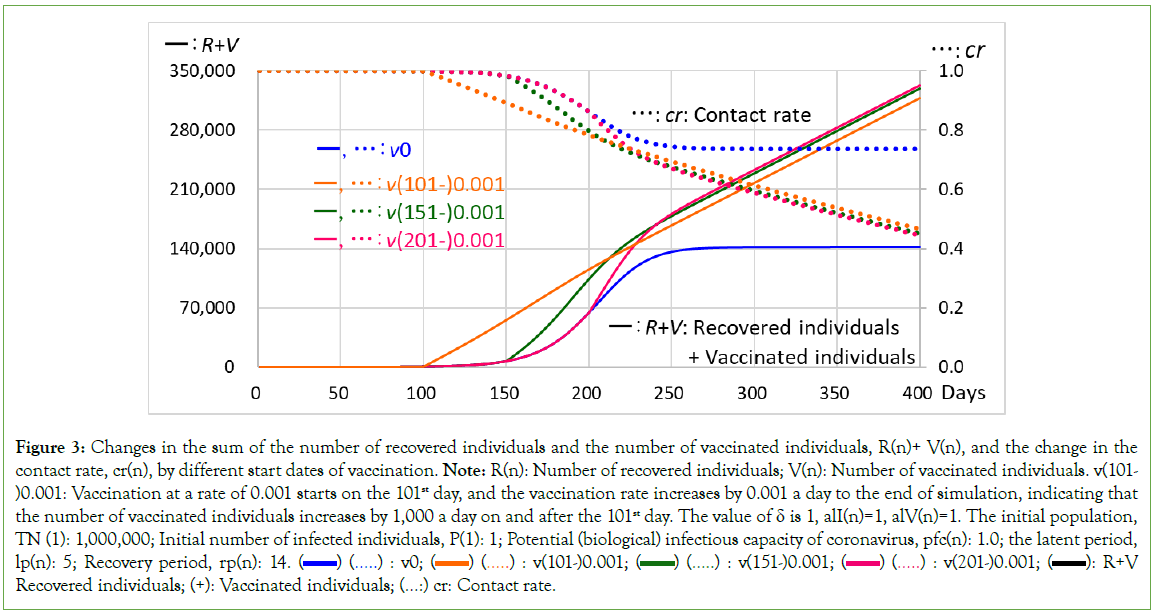
Figure 3: Changes in the sum of the number of recovered individuals and the number of vaccinated individuals, R(n)+ V(n), and the change in the
contact rate, cr(n), by different start dates of vaccination. Note: R(n): Number of recovered individuals; V(n): Number of vaccinated individuals. v(101-)0.001: Vaccination at a rate of 0.001 starts on the 101st day, and the vaccination rate increases by 0.001 a day to the end of simulation, indicating that the number of vaccinated individuals increases by 1,000 a day on and after the 101st day. The value of δ is 1, alI(n)=1, alV(n)=1. The initial population,
TN (1): 1,000,000; Initial number of infected individuals, P(1): 1; Potential (biological) infectious capacity of coronavirus, pfc(n): 1.0; the latent period,
lp(n): 5; Recovery period, rp(n): 14.  R+V Recovered individuals; (+): Vaccinated individuals;
  Contact rate.
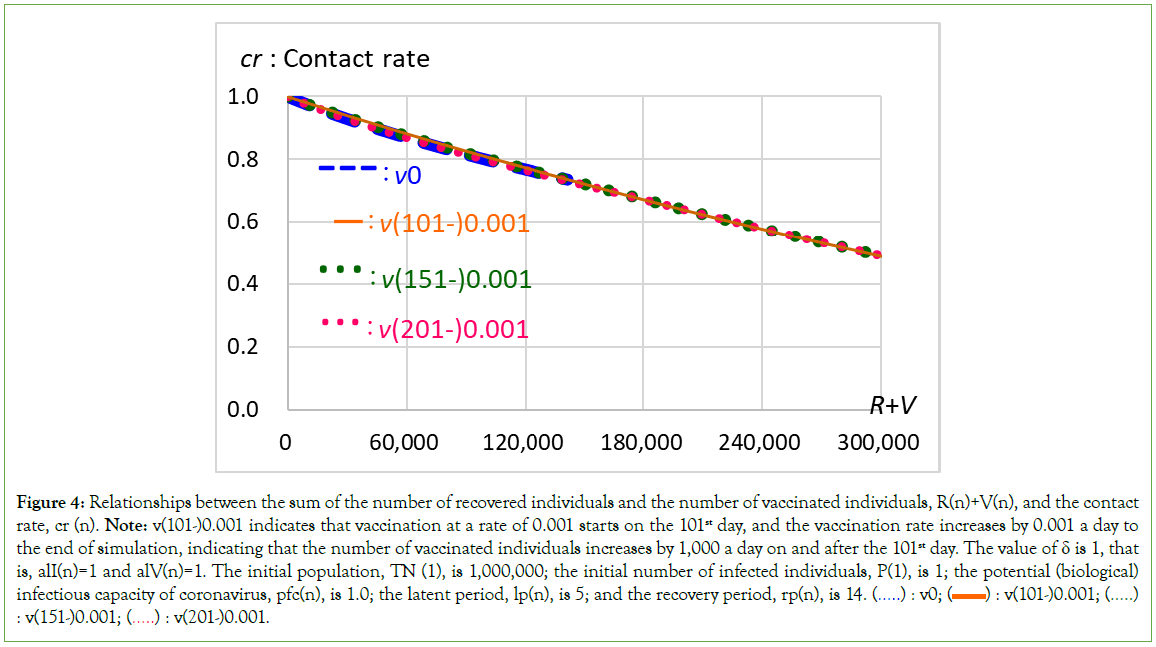
Figure 4: Relationships between the sum of the number of recovered individuals and the number of vaccinated individuals, R(n)+V(n), and the contact rate, cr (n). Note: v(101-)0.001 indicates that vaccination at a rate of 0.001 starts on the 101st day, and the vaccination rate increases by 0.001 a day to the end of simulation, indicating that the number of vaccinated individuals increases by 1,000 a day on and after the 101st day. The value of δ is 1, that is, alI(n)=1 and alV(n)=1. The initial population, TN (1), is 1,000,000; the initial number of infected individuals, P(1), is 1; the potential (biological) infectious capacity of coronavirus, pfc(n), is 1.0; the latent period, lp(n), is 5; and the recovery period, rp(n), is 14. (…..) : v0;  : v(151-)0.001;
  v(201-)0.001.
Calculation of the number of infected individuals, the number of individuals newly infected a day and the increment/decrement in the number of infected individuals: The number of infected individuals, P(n), should not equal the number of individuals infected each day, AP(n), which is usually announced. The former is the total number of infected individuals existing in the community, that is, the sum of the number of infected individuals during the latent period and/or the recovery period, whereas the latter is the number of individuals newly infected for one day. However, P(1), the initial number of infected individuals, is arbitrarily set for simulation. The increment and/or decrement in the number of infected individuals on date n in the community, Δ P(n), can be calculated by subtracting the number of individuals isolated on date n from the number of individuals newly infected on date n.
For the simulation, using an Excel file, the calculation is performed based on Equation (2). The Excel files and the meanings of the individual terms/variables are explained in the supplementary files. The independent variables of twenty terms can be set arbitrarily and the values of the dependent variables of fifty-six terms are uniquely determined based on the independent values were given.
The number of individuals newly infected on date n, AP(n), is given by the following equation 2:
AP(n(night))=(pfc(n)/lp(n))*(RM(n)/N(n))*icf(n)*
(1-(alI(n)*(CRI(n)+CRT(n))+al(n)*CRAS(n)+alV(n)*V(n))/ N(n))*(RP(n)/N(n))*RM(n) (2)
Where, the coefficient pfc(n) is the potential (biological) infectious capacity of coronavirus, which is an approximate value indicating the number of susceptible individuals infected during the latent period, lp(n). The latent period, lp(n), is the time interval between when an individual is infected and when he/she is symptomatic. ‘pfc(n)/lp(n)’ is the number of susceptible individuals infected by an infected individual a day, and its value, including decimal places, is used in the calculation. The coefficient icf(n) is the infection reduction rate caused by infection control measures preventing the spread of the virus, such as facemasks, partitions and disinfectants. The coefficient alI(n) is the activity level of the recovered individuals. CRI(n)+CRT(n), where CRI(n) is ΣRI(n) and RI(n) is the number of individuals who were isolated due to being test positive and had returned to the community; these are all the recovered individuals who returned to the community and are equivalent to CRT(n) in Equation (1’). All (n) is the activity level of the recovered individuals, CRAS(n), who have recovered from the ‘asymptomatic’ individuals in the community, and alV(n) is the activity level of the vaccinated individuals, V(n). (1-(alI(n)*(CRI(n)+CRT(n))+al(n)*CRAS(n) +alV(n)*V(n)) is equivalent to (1- δ(R(n) of Equation (1).
In a strict sense, since an infection occurs during the day from the morning to the evening, for the purpose of calculation, AP (n(night)), which is the value of AP(n) at night, is the correct number of individuals newly infected a day. This number increases/ decreases from the AP(n) in the morning, which is equal to the AP(n) of the previous night, that is, AP(n-1(night)).
RM(n) is the number of susceptible individuals in the community, which is equivalent to S(n) in Equations (1) and (1’), N(n) is the population excluding the individuals kept in isolation and the dead, and RP(n) is the number of infected individuals excluding the individuals kept in isolation and the dead. As previously mentioned, CRI(n) is the ΣRI(n), and RI(n) is the number of recovered individuals who were isolated because of being test positive and have returned to the community after the isolation period ended; CRT(n)=ΣRT(n) and RT(n) are the number of recovered individuals who were isolated because of being symptomatic and have returned to the community after the isolation period ended; CRAS(n) is the ΣRAS(n), and RAS(n) is the number of recovered individuals who were infected but were not symptomatic, were not isolated, were staying in the community, had continued to infect until the recovery period ended and then became the recovered individuals; and V(n) is the number of vaccinated individuals who have immunity and are living and working in the community as the recovered individuals do.
RM(n) is the number of susceptible individuals in the community, as mentioned above. The number of susceptible individuals was calculated by subtracting the number of individuals confirmed to be infected due to being test positive and isolated (CI), the cumulative number of individuals infected (CAP), which included the number of individuals who have recovered, and the number of vaccinated individuals (V) from the total population of the community, TN; therefore, the number of susceptible individuals is given by equation 3:
RM(n)=TN(n)-(CI(n)+CAP(n)+V(n)) (3)
Where, TN(n) is the total population of the whole community, such as a city. TN(1) is the initial population of the community arbitrarily given by you, and TN(n) is changed by coming in/going out of the susceptible individuals (NAP(n)) and/or the infected individuals (UP(n)).
CI(n)=ΣI(n), and I(n) is the number of individuals isolated due to being test positive. Since all the individuals confirmed to be infected due to test positivity are not always isolated and the individuals decided to be isolated are isolated on the day next to the date when they are confirmed to be infected, in the actual calculation, I(n) is given by equation 4:
I(n)=CP(n-1)*i(n-1) (4)
Where the coefficient i(n) is the isolation rate for individuals who are confirmed to be infected because of being test positive. CP(n) is the number of individuals confirmed to be infected because of being test positive. The individuals who decide to be isolated are isolated on the next day for the purpose of calculation. Conversely, the individuals confirmed to be infected on the previous day, date (n-1), are isolated on date n. Thus, I(n) is given by Equation (5).
CP(n) is given by:
CP(n)=T(n)*bp(n)*ir(n) (5)
Where, T(n) is the number of individuals who underwent PCR and/ or antibody testing, which can be set arbitrarily on any day when tests are performed, and the coefficient bp(n) is the magnification of the incidence rate for the test to the incidence rate, ir(n), in the community. The incidence rate, ir(n), is given by equation 6:
ir(n)=P(n)/TN(n) (6)
Where, P(n) is the number of infected individuals already living in the community and P(1) is the initial number of infected individuals in the community and is arbitrarily were given. TN(n) is the total population of the whole community. Since individuals who have the test are mainly close contacts, the incidence rate for the test would be biased to be higher than ir(n). The incidence rate for the test is given by the magnification with respect to ir(n). The value of bp(n)*ir(n) indicates the percentage of positive results for the PCR and/or antibody test, that is, the ‘positive rate’ in the test, tir(n). The positive rate, tir(n), is given by equation 7:
tir(n)=bp(n)*ir(n) (7)
CAP(n) is the ΣAP(n) and indicates the cumulative number of individuals newly infected a day up to the morning of date n; this value is equal to the cumulative number of infected individuals up to the night of date (n-1).
V(n) is the number of vaccinated individuals who are vaccinated and have immunity and is given by equation 8:
V(n)=TN(1)*(v(n)-b(n)) (8)
Where, TN(1) is the initial total population of the community, the coefficient v(n) is the vaccination rate, and b(n) is the breakthrough rate. The number of vaccinated individuals is further explained in section 4-1 ‘Number of vaccinated individuals.’ The value of b(n) should be set to 0 on the day when breakthrough infection does not occur.
RP(n) is the number of infected individuals excluding the individuals kept in isolation and the dead, that is, the number of infected individuals living and working in the community; for example, the number of infected individuals during the latent period and/or asymptomatic infected individuals even after the latent period. Thus, RP(n) could be called the ‘Spreader’ who continues to infect susceptible individuals in the community. When n is 1, which indicates the first day of simulation, RP(1) is equal to P(1), which is the initial number of infected individuals in the community and is arbitrarily given by you. Since RP(n) is the number of infected individuals minus the number of isolated individuals (PI(n)), the number of dead individuals (DAS(n)) and the number of recovered individuals living in the community (RAS(n)) from the total number of infected individuals up to date n are given by the following equation 9:
RP(n)=Σ(AP(n)-PI(n-1)-DAS(n-1)-RAS(n)) (9)
Where, PI (n) is the number of symptomatic individuals who became symptomatic on the day after the end of the latent period in the real community and were isolated the next day. PI (n) is given by equation 10:
PI(n)=AP(n-(lp+1))*syr(n-(lp+1)) (10)
Where, lp(n) is the latent period and (n-(lp+1)) indicates the ‘latent period+1’ before date n, meaning the day after the end of the latent period, because the infected individuals become symptomatic and are isolated on the day after the end of the latent period, as explained in the 4-3 ‘Symptomatic rate’. The value of AP(n-(lp+1)) is the number of infected individuals who were newly infected on date (n-(lp+1)), which is the day after the end of the latent period. The coefficient syr (n) is the symptomatic rate on date n. When syr(n) is 1, all the infected individuals become symptomatic and isolated.
Conversely, therefore, the number of asymptomatic infected individuals, AS(n), is given by equation 11;
AS(n)=AP(n-(lp+1))-PI(n) (11)
DAS(n) is the number of individuals who are asymptomatic and die of infection after the latent period in the community, that is, the death toll in the community. It is given by equation 12:
DAS(n)=AS(n-trunc((rp-lp)/2))*fr(n-trunc((rp-lp)/2)) (12)
Where, the coefficient rp(n) is the recovery period, which is the time interval between when an individual is infected and when he/ she recovers from the disease and is not capable of infecting. ‘(rp-lp)’ is equivalent to the isolation period. AS(n-trunc((rp-lp)/2)) is the number of asymptomatic infected individuals who were not isolated and were staying in the community on the day ‘trunc((rp-lp)/2) days’ before date n. AS(n) is the number of infected individuals subtracting PI from AP, as shown by Equation (11); the coefficient fr(n) is the fatality rate for the asymptomatic infected individuals in the community. Death of infected individuals occurs in the middle of the isolation period, that is, ‘trunc((rp-lp)/2)’. Namely, some of the infected individuals who have been isolated on date n die on date (n+trunc((rp-lp)/2)). For asymptomatic individuals, the same procedure was used. When the number of asymptomatic individuals infected on date n is AS(n), the AS(n)* fr(n) individuals also die on date (n+trunc((rp-lp)/2)). Conversely, the death toll of asymptomatic individuals on date n, DAS(n), is given by Equation (12).
RAS(n) is the number of recovered individuals who were infected but were asymptomatic and were not isolated; these individuals continued to infect susceptible individuals in the community until the recovery period ended, after which they became recovered individuals. In the actual calculation, RAS(n) is the number of asymptomatic infected individuals excluding the death toll, and it is given by equation 13:
RAS(n)=AS(n-(rp-lp))-DAS(n-(1+trunc((rp-lp)/2)))=AS(n-(rp-lp))- AS(n-(rp-lp))*fr(n-(rp-lp)) (13)
CRI(n) is the ΣRI(n), and RI(n) is the number of recovered individuals who were isolated due to being test positive. RI(n) is given by equation 14:
RI(n)=I(n-rpI)-DTI(n-(1+trunc(rpI/2))) (14)
Where, I(n) is the number of individuals isolated due to being test positive and given by Equation (4). DTI(n) is the death toll of the individuals isolated due to being test positive and is given by equation 15:
DTI(n)=I(n-trunc(rpI/2))*frI(n-trunc(rpI/2))… (15)
Where, frI(n) is the fatality rate for the isolated individuals and rpI(n) is the isolation period for the isolated individual due to being test positive, which is less than or equal to rp. The deaths of isolated individuals occurred during the middle of the isolation period. When the number of individuals isolated on date n is I(n), the I(n)* frI(n) individuals die on day ‘(n+rpI/2) days’ after date n. Conversely, for the death toll on date n, the date of death of I is (n-trunc(rpI/2)).
CRT(n)=ΣRT(n), and RT(n) is the number of recovered individuals who were isolated due to being symptomatic in the community. RT(n) is given by equation 16:
RT(n)=PI(n-(rp-lp))-DT(n-(1+trunc((rp-lp)/2))) (16)
Where, DT(n) is the death toll of the individuals isolated due to being symptomatic in equation 7.
DT(n)=PI(n-trunc((rp-lp)/2))*frI(n-trunc((rp-lp)/2)) (17)
Where, PI (n) is the number of symptomatic infected individuals given by Equation (10) and frI(n) is the fatality rate for the isolated individuals. ‘(rp-lp)’ is the isolation period for the individuals isolated due to being symptomatic in equation 18.
For calculation, Equation (2) is transformed to the following equation:
AP(n(night))= p(n)* RM(n) (18)
Where, p(n) is the infection coefficient, which is the infectious capacity and includes the contact rate that changes with the number of susceptible individuals, infected individuals, recovered individuals and vaccinated individuals in the (real) community shown in equation 19:
p(n)=(pfc(n)/lp(n))*(RM(n)/N(n))* icf(n)* (1-(AL(n)/N(n)))*(RP(n)/ N(n)) (19)
Where, AL(n) is the sum of the activity levels of the recovered individuals and vaccinated individuals shown in equation 20:
AL(n)=alI(n)*(CRI(n)+CRT(n))+al(n)*CRAS(n)+alV(n)*V(n) …(20)
The term AL(n)/N(n) is equivalent to the term δ(R(n)/N(n)), and the term ‘1-(AL(n)/N(n))’ is equivalent to the term (1- δ(R(n)/N(n)) of Equation (1). When the value of AL(n) is given by 1, the activity of the recovered individuals is the same as that of the susceptible individuals, and when the value of AL(n) is given by 0, the recovered individuals are not active, meaning a similar condition as they are kept in isolation, although the number of recovered individuals who have returned to the community is added to the population.
The value of pfc(n)/lp(n) is the infection rate (persons/person/day) for an infected individual, and (RP(n)/N(n) indicates the ratio of the number of infected individuals living in the community. Thus, the value of (pfc(n)/lp(n))* (RP(n)/N(n)) indicates the probability of occurrence of infection by the total number of infected individuals in the community. The value of (RM(n)/N(n))*(1-(AL(n)/N(n))) indicates the probability of contact occurring for a susceptible individual. Therefore, the coefficient p(n) indicates the possibility of infection per susceptible individual per day in the community with mixed infected, susceptible and recovered individuals.
The infected individuals, P(n), are given by the following equation 21:
P(n)=RP(n)+AP(n(night))=RP(n)+p(n)*RM(n) (21)
Considering the number of isolated individuals, the rate of change in the number of infected individuals, ΔP(n), that is, the increment and/or decrement in the number of infected individuals a day in the community, can be calculated by subtracting the number of individuals isolated on date n due to being symptomatic from the number of individuals newly infected on date n and is given by the following difference equation 22:
ΔP(n)=AP(n)-PI(n)=AP(n)-syr(n’)*AP(n’) (22)
Where, n’ is the date ‘the latent period’ before date n and indicates that PI(n) is the number of individuals who were newly infected on date n’, were symptomatic on the day after the end of the latent period and were subsequently isolated on date n.
As previously mentioned, N(n) is the population excluding the individuals kept in isolation and dead but including the recovered individuals who returned to the community; that is, the total number of individuals living and working in the community is given by the following difference equation 23:
N(n)=TN(n-1)-(CI(n-1)+CPI(n-1)+CDAS(n-1)+CDT(n-1))+CRI(n-1)+CRT(n-1) (23)
Where, TN(n) is the total population of the community. When n is 1, meaning the first day of simulation, N(1) is TN(1), TN(1) is the initial population of the community, and the other terms of Equation (23) are all 0. The use of ‘(n-1)’ means that the population on the previous night becomes the population on the morning of date n. As previously noted, TN(n) is changed by the number of susceptible individuals (NAP(n)) and/or infected individuals (UP(n)) who come in and/or leave the community. CI(n)=ΣI(n), CPI(n)=ΣPI(n), CDAS(n) is ΣDAS(n), CDT(n)=ΣDT(n), CRI(n) is ΣRI(n) and CRT(n)=ΣRT(n).
For the simulation using Equation (2) and/or Equation (18), when n is 1, meaning the first day of simulation, N(1) is equal to TN(1), which is the initial total population of the community. TN(1) is arbitrarily set by the user. RP(1) is equal to P(1), which is the initial number of infected individuals. P(1) is also arbitrarily set by the user. RM(1) is the initial number of susceptible individuals in the community and is inevitably determined by subtracting P(1) from N(1).
Materials and Methods
Number of vaccinated individuals
Since the vaccination status of the community is generally expressed by the ‘vaccination rate’, which is the ratio of the number of vaccinated individuals to the population, the vaccination rate is used and given by an independent variable in the compartment model proposed by Ohmori [1]. Thus, as previously mentioned, the number of vaccinated individuals, V(n), is given by Equation (24):
V(n)=TN(1)*(v(n)-b(n)) (24) (= 8)
Where, TN(1) is the initial total population of the community, the coefficient v(n) is the vaccination rate, and b(n) is the breakthrough rate. The term (v(n)-b(n)) indicates the immunity acquisition rate for the purpose of calculation. However, note the following: For the individuals who were vaccinated and had once immunity, some of them would suffer breakthrough infection considerably later after the date when they were vaccinated. For example, when vaccination is conducted on date n, breakthrough infection could occur on date (n+m), where m would indicate dozens of days. Therefore, b(n) should be applied to individuals who were vaccinated on date (n-m) and were infected by ‘breakthrough infection’ on date n. The value of m is arbitrarily supposed/decided for simulation by referring to the durations that are reported in terms of the waning of vaccine effectiveness [3-9], for example, “the vaccine effectiveness persists/ decreases by 1 month and/or 6 months”.
The value of b(n) should be set to 0 on the day when breakthrough infection does not occur. The vaccinated individuals who become infected are reset to be susceptible individuals on the date when breakthrough infection occurs.
The simulation of a case with one day of vaccination is convenient for obtaining a clear effect of vaccination. However, vaccination usually continues almost every day after the start of mass vaccination, and the number of vaccinated individuals increases daily. Namely, in the Excel file, the value of the vaccination rate on date n, v(n), should be set every day, and v(n) should be greater than or equal to v(n-1), that is, v(n) ≧ v(n-1).
For example, when the vaccination rate, v(n), is 0.001 on the first day of vaccination and increases by 0.001 a day and b(n) is 0 for a community whose population is 1,000,000, v(n) should be set to 0 each day before the start of vaccination. On the first day of vaccination, v(n) is set to 0.001, indicating that the number of vaccinated individuals is 1,000. On the second day, v(n) should be set to 0.002, meaning that the vaccination rate increases by 0.001 a day; that is, the number of vaccinated individuals increases to 2,000, that is, 1,000+1,000. On the third day, v(n) should be set to 0.003, meaning that the vaccination rate also increases by 0.001 a day, that is, 0.002+0.001, and the number of vaccinated individuals reaches 3,000, that is, 2,000+1,000. If v(n) is set to 0.005 on the fourth day, meaning that the vaccination rate increases by 0.002 a day, that is, 0.003+0.002, the number of vaccinated individuals increases to 5,000 on the fourth day, that is, 3,000+2,000.
After the last day of vaccination, the value of v(n) should not be set to 0 but set equal to that of v(n) on the last day because v(n) indicates the ratio of the number of vaccinated individuals presently existing in the community to the population. For example, when vaccination is stopped on date x, v(x+α) (α=1, 2, 3, ・・・) should be set equal to v(x) up to the end of the simulation, that is, v(x+α)=v(x). For example, when vaccination is stopped on date x and v(x) is 0.1, the number of vaccinated individuals is 100,000 on the last day of vaccination, and v(x+1) on the next day should be set to 0.1, meaning that the number of vaccinated individuals is the same as that on the last day, that is, 100,000. The value of v(x+2) should be set to 0.1, v(x+3) should also be set to 0.1, and so on. The number of vaccinated individuals does not change to the end of the simulation, and the total number of vaccinated individuals is 100,000.
Start and end of mass vaccination affecting the change in the number of infected individuals
An increase in the number of vaccinated individuals reduces not only the number of susceptible individuals but also the contact rate, resulting in a decrease in the number of infected individuals. As expected, it is clearly shown that the greater the number of vaccinated individuals and the earlier the vaccination date are, the smaller the number of infected individuals becomes (Ohmori [1]). However, since the development of a COVID-19 vaccine for a new strain and/or a variant should take several weeks to progress to practical use, mass vaccination can be started several weeks after the infection occurs. For technical and/or political (or economic) reasons, the quantity of vaccines is also limited in many cases. Thus, mass vaccination can be started several dozen days after the infection occurs and for a limited number of individuals. As previously mentioned, v(n) should be set to 0 for the days before the start of mass vaccination.
Vaccination (mass vaccination) can be terminated at any time by a political decision considering the situation with COVID-19. However, it is difficult to determine which situation is adequate to end vaccination when the infection is ongoing.
The mass vaccination duration here is the period from the start to the end of mass vaccination, and the number of infected individuals varies according to the difference in the vaccination rate and mass vaccination duration. Therefore, using the flexible compartment model proposed by Ohmori [1], changes in the number of infected individuals a day and in the total number of infected individuals at the end of infection was calculated for different durations of mass vaccination and with different vaccination rates.
Symptomatic rate
From a statistical point of view, all infected individuals do not become symptomatic before the end of the latent period. After the end of the latent period, however, the infected individuals are separated into two categories: symptomatic individuals and asymptomatic individuals. Symptomatic individuals develop symptoms such as fever or chills, cough, fatigue, muscle or body aches, loss of taste or smell, nausea or vomiting and diarrhea. Symptoms usually appear 2 to 14 days after exposure to the virus (CDC, Seladi-Schulman, Sanghvi S, Weinberg AS, Hollimon N, and the Mayo Clinic [14-19]). From a statistical point of view, symptoms appear on the day after the end of the latent period. The latent period is arbitrarily given for simulation by referring to the days mentioned above. Asymptomatic individuals do not develop any symptoms even after the end of the latent period, that is, throughout the infectious period (the recovery period), which includes the latent period. All individuals in both categories became ‘recovered’ individuals after the end of the recovery period.
The symptomatic rate, syr, is the ratio of the number of individuals who become symptomatic to the total number of individuals newly infected a day. However, note the following: Symptoms occur on the day after the latent period. Specifically, the individuals who were infected on date n became symptomatic on date (n+lp), and syr(n) indicates the ratio of the number of individuals who were infected on date n and became symptomatic on date (n+lp) to the total number of individuals newly infected on date n. Thus, for the purpose of calculation, the date ‘n’ of syr (n) indicates the date n when the symptomatic individuals are infected, although they become symptomatic on date (n+lp). The latent period includes the day when the individuals are infected. The infected individuals are isolated because they are symptomatic the next day, that is, on date (n+(lp+1)). Namely, the infected individuals who were infected on date n became symptomatic on date (n+lp) and were isolated the next day (n+(lp+1)), that is, the day after the end of the latent period. Therefore, again, the symptomatic rate expressed as ‘syr (n)’ refers to the symptomatic rate for individuals who were infected on date n and were isolated on date (n+(lp+1)).
As not all infected individuals are symptomatic, all infected individuals are not always isolated. The number of isolated individuals, PI(n), which indicates the number of symptomatic infected individuals isolated a day on date n, is given by Equation (25):
PI(n)=AP(n-(lp+1))*syr(n-(lp+1)) (25)(=10)
Where, date n indicates the day after the end of the latent period and date (n-(lp+1)) indicates the date when the individuals who were isolated on date n were infected. Thus, the value of AP(n- (lp+1)) is the number of infected individuals who were newly infected on date (n-(lp+1)), and some of them should be isolated on date n. Date (n-(lp+1)) is equivalent to n’ in Equation (22).
For example, when the symptomatic rate, syr(n), is set to 0.8 and the latent period, lp(n), is set to 5, 80% of the individuals infected on the first date of simulation become symptomatic on the 6th, which is the day after the end of the latent period, and they are isolated on the 7th. However, 20% of the individuals infected on the first date do not become symptomatic on the 6th day, are asymptomatic, are not isolated and stay in the community. The number of asymptomatically infected individuals, AS(n), is given by Equation (26):
AS(n)=AP(n-(lp+1))-PI(n) (26) (=11)
Asymptomatic individuals continue to infect susceptible individuals in the community until the recovery period ends, after which they become ‘recovered’ individuals in the community. In the actual calculation in the Excel file, AP(n) in the morning on date n is given by equation 27:
AP(n)=RPM(n)–RP(n-1) (27)
Where, RP(n-1) is the number of infected individuals existing on the previous day, excluding the individuals kept in isolation and the dead; RP(n) is given by Equation (9); and RPM(n) is the remaining number of infected individuals in the community excluding the number of individuals isolated due to being test positive but including the number of individuals who test positive but are not isolated by equation 28:
RPM(n)=P(n)+UP(n)-I(n-1) (28)
Where, P(n) is the number of infected individuals in the morning on date n, meaning the number of infected individuals before any isolated individuals and/or the number of dead individuals have been taken away; UP(n) is the number of infected individuals coming in/going out of the community; and I(n) is the number of individuals isolated due to being test positive. The value of AP(n) includes symptomatic infected individuals, asymptomatic infected individuals and individuals who tested positive but were not isolated and were staying in the community.
The value of AP(n) in the morning on date n is equal to that of the previous night, that is, AP(n-1(night)). After the individuals who became symptomatic on the previous day (on date (n-1)) were isolated and the individuals who died on the previous day were removed, the number of infected individuals was calculated. For the purpose of calculation, the infection occurs during the daytime from the morning to the evening; thus, the number of individuals newly infected on that day (on date n) is given as AP(n(night)) by Equation (2), and the number of infected individuals existing at night on that day, P(n(night)), is given by Equation (21).
Results and Discussion
Outcome variations: Symptomatic rate 0, start on day 51
When the symptomatic rate is set to 0, all infected individuals are not symptomatic and are not isolated. They are ‘asymptomatic’ and stay in the community, continue infecting susceptible individuals until the recovery period ends, and then become ‘recovered’ individuals who have immunity in the community. For such a case, the number of infected individuals increases to a peak and then decreases. This phenomenon is explained by ‘herd immunity’, which is indirect protection against the spread of infection caused by the immunity of a large proportion of the population. The contact rate between infected individuals and susceptible individuals should be reduced by increasing the number of recovered individuals. As a result, the number of infected individuals must be considerably decreased due to the increase in the number of recovered individuals. The cumulative number of infected individuals at the peak, which is the turning point at which the number of infected individuals changes from increasing to decreasing, is one of the herd immunity thresholds; a ‘potential’ herd immunity threshold without any intervention, which is a merkmal of herd immunity and would be a target value for mass vaccination, the purpose of which is noted by Heymann and Aylward [20], as “the most widely accepted reason for mass vaccination is to rapidly increase population (herd) immunity in the setting of an existing or potential outbreak, thereby limiting the morbidity and mortality that might result”. From another point of view, infected individuals are equivalent to individuals who ‘will not be infected after this’. Thus, when the cumulative number of individuals who will not be infected exceeds the herd immunity threshold, the number of infected individuals must change from increasing to decreasing. The individuals categorized as individuals who will not be infected are not only infected/recovered individuals but also vaccinated individuals.
For the community in which the initial population, TN(1), is 1,000,000, and under the condition that the initial number of infected individuals, P(1), is 1, the potential (biological) infectious capacity of coronavirus, pfc(n), is 1.0, the latent period, lp(n), is 5, and the recovery period, rp(n), is 14; when the symptomatic rate, syr, is set to 0 and the vaccination rate is set to 0 on and after the first day of simulation, the number of individuals newly infected a day (AP) reached 23,655 at the peak on the 79th, with a cumulative number of 300,807, and then decreased to 0 on the 153rd. The number of infected individuals, P, reached 336,268 at the peak on the 87th, with a cumulative number of 466,620. After the peak, the number of infected individuals decreased to 0 on the 178th, with a total number of infected individuals, TI, of 598,287 (Table 2 and Figure 5). The cumulative number of infected individuals at the peak for P, which is the turning point at which the number of infected individuals changes from increasing to decreasing, is one of the ‘herd immunity thresholds’ and is a target value for vaccination. Namely, the cumulative number of 466,620 could be a herd immunity threshold.
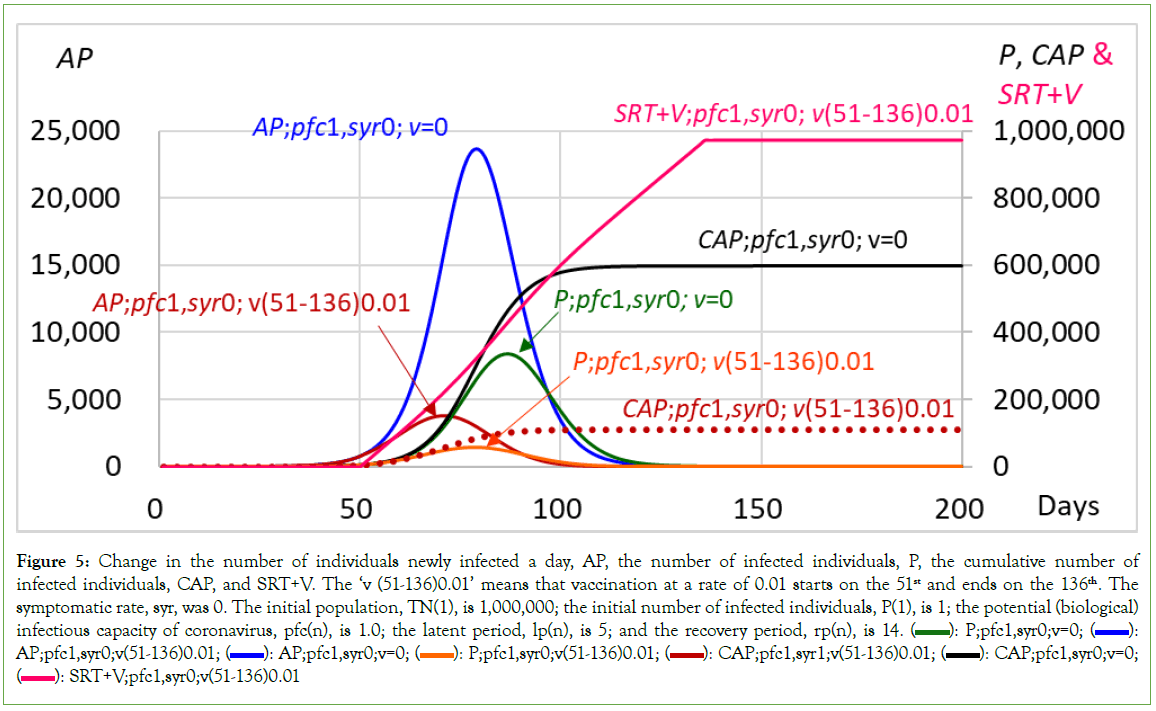
Figure 5: Change in the number of individuals newly infected a day, AP, the number of infected individuals, P, the cumulative number of
infected individuals, CAP, and SRT+V. The ‘v (51-136)0.01’ means that vaccination at a rate of 0.01 starts on the 51st and ends on the 136th. The symptomatic rate, syr, was 0. The initial population, TN(1), is 1,000,000; the initial number of infected individuals, P(1), is 1; the potential (biological) infectious capacity of coronavirus, pfc(n), is 1.0; the latent period, lp(n), is 5; and the recovery period, rp(n), is 14.  AP;pfc1,syr0;v(51-136)0.01;
  CAP;pfc1,syr0;v=0;
  SRT+V;pfc1,syr0;v(51-136)0.01
| v(51-xx); | Infected/day:AP | Infected:P | On date xx | Total on the end date of P | |||||||||||
|---|---|---|---|---|---|---|---|---|---|---|---|---|---|---|---|
| 0.01; | xx | Date of peak | Number | Date of end | Date of peak | Number | Date of end | AP | P | SRT+V | CAP | SRT+V | TI (Total Infection) | Δ Infection/day | Δ During/day |
| 150 | 71 | 3798 | 119 | 79 | 56206 | 137 | 0 | 0 | 1000000 | 111029 | 1000000 | 111029 | 0 | 0 | |
| 136 | 71 | 3798 | 119 | 79 | 56206 | 137 | 0 | 1 | 971028 | 111029 | 971029 | 111029 | 0 | 0 | |
| 119 | 71 | 3798 | 119 | 79 | 56206 | 138 | 0 | 268 | 800826 | 111028 | 801029 | 111029 | 0 | -0.1 | |
| 100 | 71 | 3798 | 133 | 79 | 56206 | 157 | 167 | 12869 | 609123 | 110434 | 611297 | 111027 | 14 | -1 | |
| 91 | 71 | 3798 | 152 | 79 | 56206 | 184 | 859 | 34198 | 486035 | 106775 | 523580 | 113580 | 85 | -3 | |
| 89 | 71 | 3798 | 159 | 79 | 56206 | 193 | 1137 | 39596 | 459000 | 104924 | 505030 | 115030 | 161 | -4.5 | |
| 85 | 71 | 3798 | 177 | 79 | 56206 | 216 | 1826 | 49169 | 404006 | 99391 | 470463 | 120463 | 236 | -5.8 | |
| 79 | 71 | 3798 | 214 | 79 | 56206 | 262 | 2988 | 56206 | 322453 | 85501 | 431999 | 141999 | 468 | -7.7 | |
| cf;pfc 1;v=0 | 79 | 23655 | 153 | 87 | 336268 | 178 | 87th | 336268 | 147823 | 466620 | 598287 | 598287 | |||
| cf;pfc 2;v=0 | 42 | 58221 | 88 | 50 | 655265 | 108 | 50th | 655265 | 79425 | 714026 | 809959 | 809959 | |||
Table 2: Comparison of the number of ‘infected/day; AP’, ‘infected; P’, ‘recovered +vaccinated; SRT+V’ and ‘the total number of infected individuals; TI’ among those calculated in the cases according to different dates at the end of vaccination. SRT: Cumulative number of recovered individuals, V: Cumulative number of vaccinated individuals; CAP: Cumulative number of infected individuals. ‘v(51-xx); 0.01’: Vaccination with a vaccination rate of 0.01 starts on the 51st and ends on date xx. The ‘87th; 336,268; 147,823; 466,620’ in the ‘cf; pfc1; v=0’ line: The number of infected individuals (P): 336,268; SRT+V : 147,823; CAP : 466,620 on the 87th, which is the date of the peak for P in the case with the pfc of 1 and without vaccination. The symptomatic rate, syr, was 0. The initial population, TN(1): 1,000,000; Initial number of infected individuals, P(1): 1; Potential (biological) infectious capacity of coronavirus, pfc(n): 1.0; Latent period, lp(n): 5; Recovery period, rp(n): 14
When vaccination is performed, the contact rate between infected individuals and susceptible individuals should be reduced by an increase in the sum of the number of recovered individuals, SRT, and in the number of vaccinated individuals, ‘Vaccinated: V’. ‘SRT’ represents all of the recovered individuals living in the community; that is, ‘Recovered: CRI+CRT+CRAS’. Namely, the number of infected individuals must decrease acceleratedly with an increase in the number of ‘recovered individuals+vaccinated individuals’, that is, SRT+V. From another point of view, SRT+V individuals are individuals who are not infected, who will not be infected and who will not infect others in the community in the future.
When vaccination at a rate of 0.01 starts on the 51st and ends on the 136th, expressed as ‘v (51-136)0.01’ in Figure 5, indicating that vaccinated individuals increase 10,000 a day from the 51st to the 136th, the number of individuals newly infected a day, AP, reaches 3,798 at the peak on the 71st and then decreases to 0 on the 119th. The number of infected individuals, P, reaches 56,206 at the peak on the 79th and then decreases to 0 on the 137th, with a total number of infected individuals, TI, of 111,029. On the 137th, the total number of vaccinated individuals, V, reached 860,000, and the total number of recovered individuals, SRT, was equal to the total number of infected individuals, TI; 111,029; thus, the SRT+V on the 137th became 971,029 (Table 2 and Figure 5). The results for v (51-136)0.01 are similar to those for v(51-150)0.01, which indicated a sufficiently long duration of mass vaccination (Table 2). Vaccination clearly significantly reduced the number of infected individuals from 596,288 in the case without vaccination to 111,029 (Table 2 and Figure 5).
On the other hand, when vaccination at a rate of 0.01 starts on the 51st and ends on the 79th, expressed as ‘v (51-79)0.01’, meaning that the number of vaccinated individuals increases 10,000 a day during the period from the 51st to the 79th, the number of individuals newly infected a day, AP, reaches 3,798 at the peak on the 71st and then decreases to 0 on the 214th. The number of infected individuals, P, reaches 56,206 at the peak on the 79th and then decreases to 0 on the 262nd, with a total number of infected individuals of 141,999. It is clear that when the vaccination ended on the 79th day, the number of infected individuals increased with a prolonged duration of infection compared to that in the case of ‘v (51-136)0.01’ (Table 2 and Figure 6).
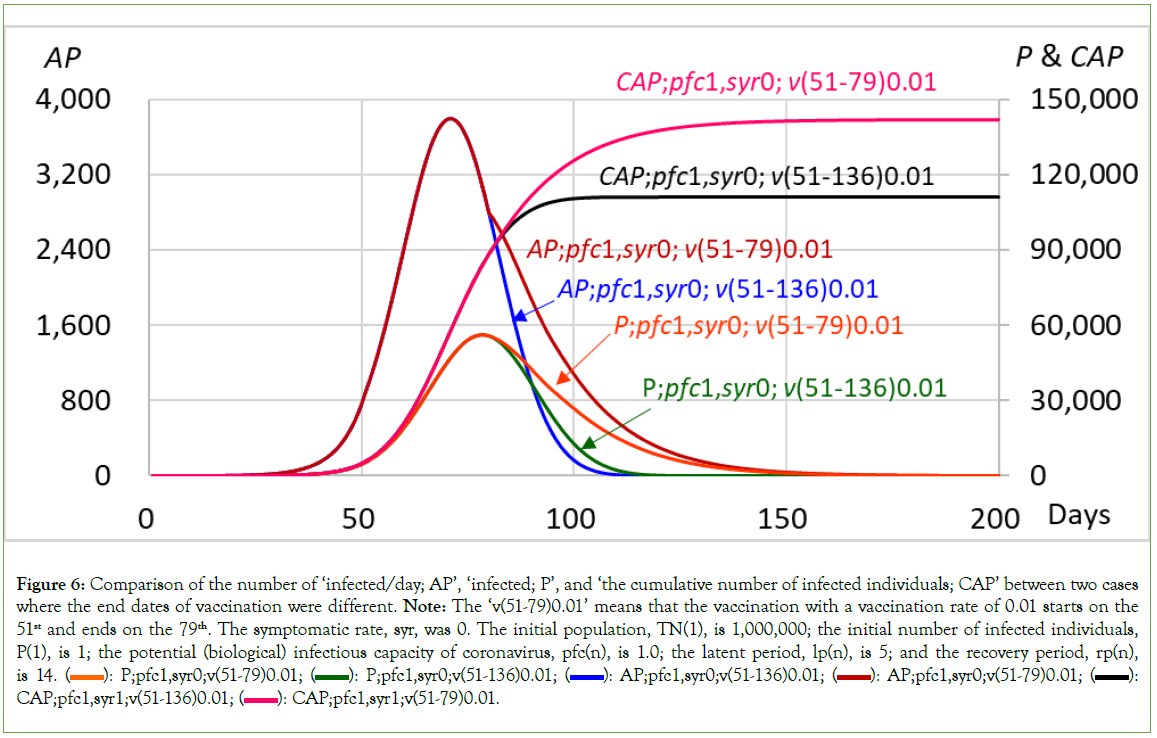
Figure 6: Comparison of the number of ‘infected/day; AP’, ‘infected; P’, and ‘the cumulative number of infected individuals; CAP’ between two cases where the end dates of vaccination were different. Note: The ‘v(51-79)0.01’ means that the vaccination with a vaccination rate of 0.01 starts on the 51st and ends on the 79th. The symptomatic rate, syr, was 0. The initial population, TN(1), is 1,000,000; the initial number of infected individuals, P(1), is 1; the potential (biological) infectious capacity of coronavirus, pfc(n), is 1.0; the latent period, lp(n), is 5; and the recovery period, rp(n), is 14.  CAP;pfc1,syr1;v(51-136)0.01;
  CAP;pfc1,syr1;v(51-79)0.01.
The changes in the date of the end of infection and in the total number of infected individuals according to different dates at the end of vaccination when vaccination at a rate of 0.01 started on the 51st day are shown in Table 2 and Figure 7. As previously noted, when the duration of mass vaccination is shortened, the number of infected individuals considerably increases, and the duration of infection, which is represented by the date of the end of infection, ‘Date’, is markedly prolonged. Especially when vaccination is stopped on or before the 89th day, the duration of infection would be considerably longer than 178 days in the case without vaccination with an increase in the total number of infected individuals, suggesting that the probability of occurrence of new strains and/or variants and breakthrough infection could be high, although the total number of infected individuals is significantly less than that of the case without vaccination, that is, 598,287.
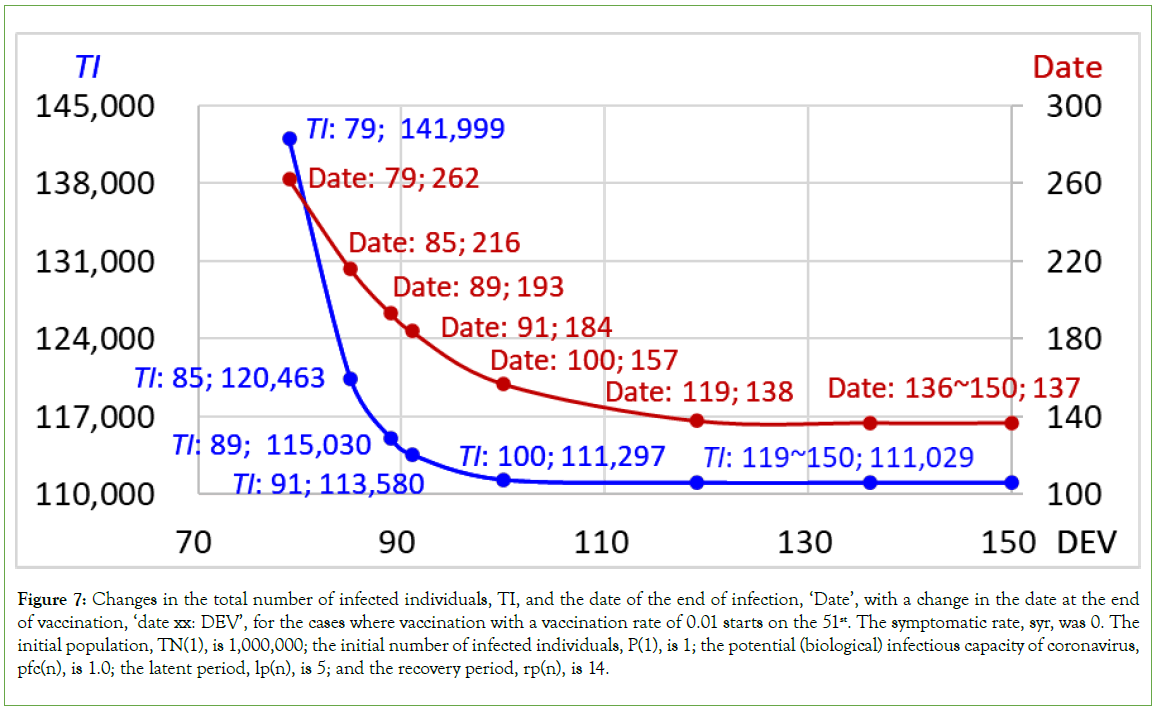
Figure 7: Changes in the total number of infected individuals, TI, and the date of the end of infection, ‘Date’, with a change in the date at the end of vaccination, ‘date xx: DEV’, for the cases where vaccination with a vaccination rate of 0.01 starts on the 51st. The symptomatic rate, syr, was 0. The initial population, TN(1), is 1,000,000; the initial number of infected individuals, P(1), is 1; the potential (biological) infectious capacity of coronavirus, pfc(n), is 1.0; the latent period, lp(n), is 5; and the recovery period, rp(n), is 14.
Changes in the total number of infected individuals, TI, and SRT+V on date xx, which is the date at the end of vaccination (‘date xx: DEV’), according to different dates at the end of vaccination (‘DEV’) for the cases where vaccination with a vaccination rate of 0.01 starts on the 51st, are shown in Table 2 and Figure 8. When the mass vaccination duration is shortened, as shown by a decrease in the value of DEV, the SRT+V decreases in proportion to the decrease in the date at the end of vaccination (DEV). As shown by the relation between SRT+V and the total number of infected individuals, for TI, when the SRT+V on date xx is equal to or less than 459,000, meaning that vaccination is stopped on or before the 89th, the number of infected individuals markedly increases.
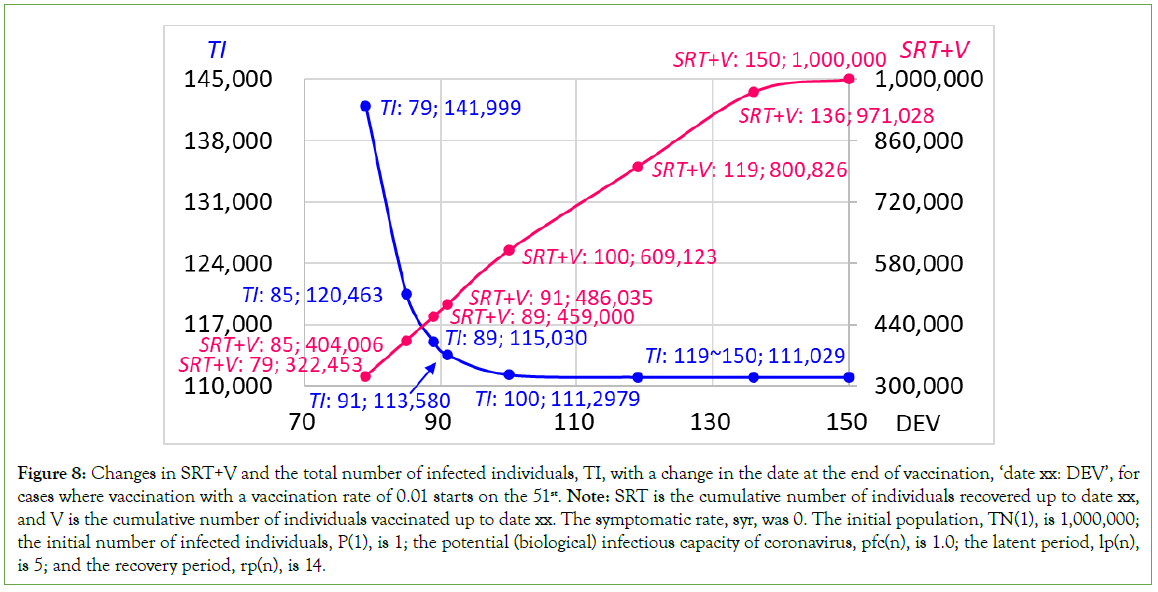
Figure 8: Changes in SRT+V and the total number of infected individuals, TI, with a change in the date at the end of vaccination, ‘date xx: DEV’, for cases where vaccination with a vaccination rate of 0.01 starts on the 51st. Note: SRT is the cumulative number of individuals recovered up to date xx, and V is the cumulative number of individuals vaccinated up to date xx. The symptomatic rate, syr, was 0. The initial population, TN(1), is 1,000,000; the initial number of infected individuals, P(1), is 1; the potential (biological) infectious capacity of coronavirus, pfc(n), is 1.0; the latent period, lp(n), is 5; and the recovery period, rp(n), is 14.
Looking at the daily change in the number of infected individuals in detail, the increment of the number of infected individuals a day (ΔInf/day), which indicates an incident rate, is 85 (persons/ day) for the case where mass vaccination is stopped on the 91st. This indicates that the increment of infected individuals a day (ΔInf/ day) is 85 (persons/day) for the period from the end of infection duration to the 157th (the total number of infected individuals of 111,297), corresponding to the 100th that is the date when mass vaccination is stopped to the end of infection duration of the 184th (the total number of infected individuals of 113,580) corresponding to the 91st that is the date when mass vaccination is stopped. Specifically, the increment of infected individuals a day is 85 (=(113,580-111,297)/(184-157); persons/day) for 27 days from the 157th to the 184th. On the other hand, the increment of infected individuals a day becomes 161 (persons/day) when vaccination is stopped on the 89th, indicating that the increment of infected individuals a day for the period from the end of infection duration (the 184th; the total number of infected individuals of 113,580), corresponding to the 91st that is the date when mass vaccination is stopped to the end of infection duration (the 193rd; the total number of infected individuals of 115,030) corresponding to the 89th that is a date when mass vaccination is stopped. Specifically, the increment of infected individuals a day is 161 (=(115,030- 113,580)/(193-184); persons/day) for 9 days from the 184th to the 193rd. The increase in the number of infected individuals per day conspicuously increases (Figure 9).
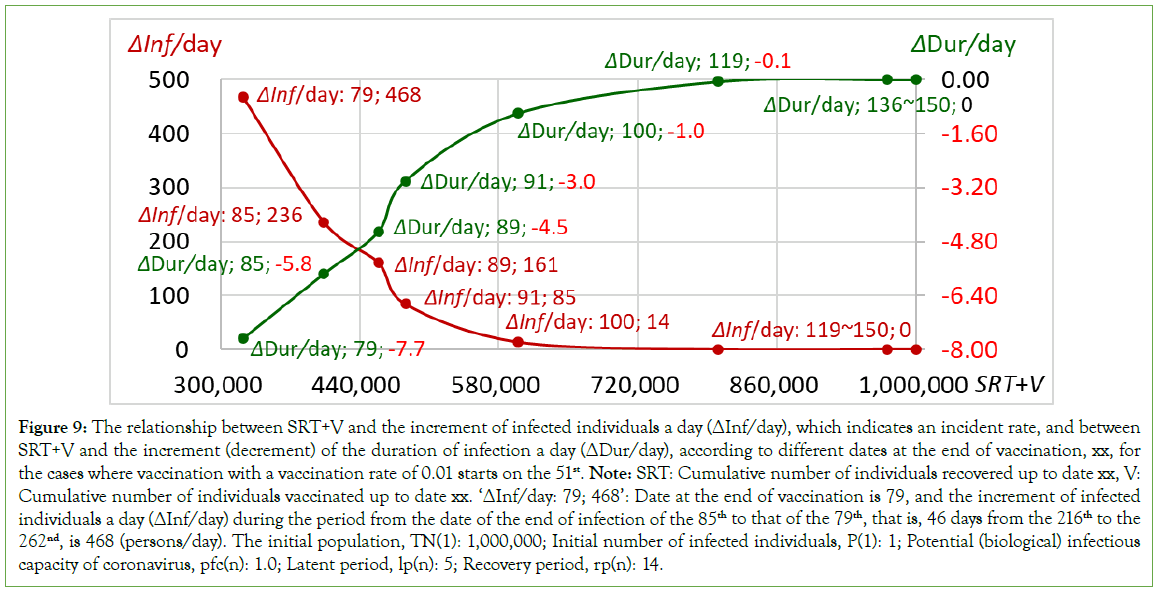
Figure 9: The relationship between SRT+V and the increment of infected individuals a day (ΔInf/day), which indicates an incident rate, and between SRT+V and the increment (decrement) of the duration of infection a day (ΔDur/day), according to different dates at the end of vaccination, xx, for the cases where vaccination with a vaccination rate of 0.01 starts on the 51st. Note: SRT: Cumulative number of individuals recovered up to date xx, V: Cumulative number of individuals vaccinated up to date xx. ‘ΔInf/day: 79; 468’: Date at the end of vaccination is 79, and the increment of infected individuals a day (ΔInf/day) during the period from the date of the end of infection of the 85th to that of the 79th, that is, 46 days from the 216th to the 262nd, is 468 (persons/day). The initial population, TN(1): 1,000,000; Initial number of infected individuals, P(1): 1; Potential (biological) infectious capacity of coronavirus, pfc(n): 1.0; Latent period, lp(n): 5; Recovery period, rp(n): 14.
The same can be said of the relationship between mass vaccination duration and infection duration. The decrease in the infection duration controlled by the mass vaccination duration, ΔDur/day, was -3.0 (days/day) for the case in which vaccination was stopped on the 91st day. This indicates a decrease in the duration of infection per day for vaccination for the period beginning at the end of the infection duration (the 157th day), corresponding to the 100th day, which was the day when mass vaccination was stopped, to the end of the infection duration (the 184th day), corresponding to the 91st day, which was the day when mass vaccination was stopped. Specifically, the decrease in infection duration per day for vaccination was -3.0 (=(157-184)/(100-91); days/day) for 9 days from the 100th to the 91st. On the other hand, the decrease in infection duration per day for vaccination was -4.5 (days/day) for the case in which the date of vaccination ended on the 89th day. This finding indicates that the decrease in infection duration per day for vaccination is -4.5 (days/ day) for the period from the end of infection duration (the 184th), corresponding to the 91st, which is the end date of vaccination, to the end of infection duration (the 193rd), corresponding to the 89th, which is the end date of vaccination. Specifically, the decrease in infection duration per day for vaccination was -4.5 (=(184-193)/ (91-89);days/day) for 2 days from the 91st to the 89th. The decrease in infection duration per day for vaccination clearly increased (Figure 9).
As previously noted, the herd immunity threshold was 466,620, which was the cumulative number of infected individuals at the peak for P on the 87th in the case without vaccination (Table 2). In the case where vaccination is stopped on the 89th, the SRT+V are 459,000, which is less than the herd immunity threshold. However, for the case where vaccination is stopped on the 91st, the SRT+V are 486,035, which is more than the threshold. Thus, a change in infection phases can be seen between the 91th and the 89th, and when vaccination is continued up to the 91st, the SRT+V is induced to more than the threshold of 466,620; in addition, the total number of infected individuals, TI, efficiently approaches the final number of infected individuals, 111,029, which is reached when the vaccination is stopped on or after the 119th, and the duration of infection is also sufficiently shortened. Namely, when vaccination is continued until the day when the SRT+V exceeds the herd immunity threshold, the total number of infected individuals is markedly reduced, and the duration of infection is also considerably shortened, as expected for the case with a sufficient duration of mass vaccination; although when vaccination is continued until the 150th, the day when the number of infected individuals (P) becomes 0, the vaccination achieves its maximum effect.
However, when vaccination is stopped on the 89th, the vaccination is unable to achieve a sufficient effect. As previously mentioned, when vaccination at a rate of 0.01 starts on the 51st, the number of individuals newly infected a day, AP, reaches 3,798 at the peak on the 71st and then decreases to 0 on the 119th. The date of the peak, 71st, is naturally before the date 89th and fairly before the date when SRT+V reaches the threshold of 466,620. As shown in the case where vaccination at a rate of 0.01 starts on the 51st and ends on the 79th, the number of infected individuals increases with a prolonged duration of infection compared to that in the case with a sufficient duration of mass vaccination (Table 2 and Figures 6-8). Thus, even if the number of individuals newly infected a day (AP), which is usually announced, changes from increasing to decreasing, vaccination should not be stopped; rather, vaccination should be continued at least until the date when the SRT+V exceeds the herd immunity threshold.
Impacts of vaccination end dates: Symptomatic rate 1, start on day 101
When the symptomatic rate, syr, is set to 1, all the infected individuals become symptomatic after the latent period ends, and they are isolated from the community. When the isolation period ends, the ‘isolated’ infected individuals become the ‘recovered’ individuals who have immunity and then return to the community.
For the community in which the initial population is TN (1), the value is 1,000,000; under the condition that the initial number of infected individuals, P (1), is 1, the potential (biological) infectious capacity of coronavirus, pfc(n), is 1.0, the latent period, lp(n), is 5, and the recovery period, rp(n), is 14; when the symptomatic rate is set to 1 and the vaccination rate is 0 through the simulation, the number of individuals newly infected a day, AP, reaches 2,135 at the peak on the 191st and 192nd and then decreases to 0 on the 326th. The number of infected individuals, P, reached 14,895 at the peak on the 194th, with a cumulative number of 83,348, and then decreased to 0 on the 342nd, with a total number of infected individuals of 141,785 (Table 3 and Figure 10).
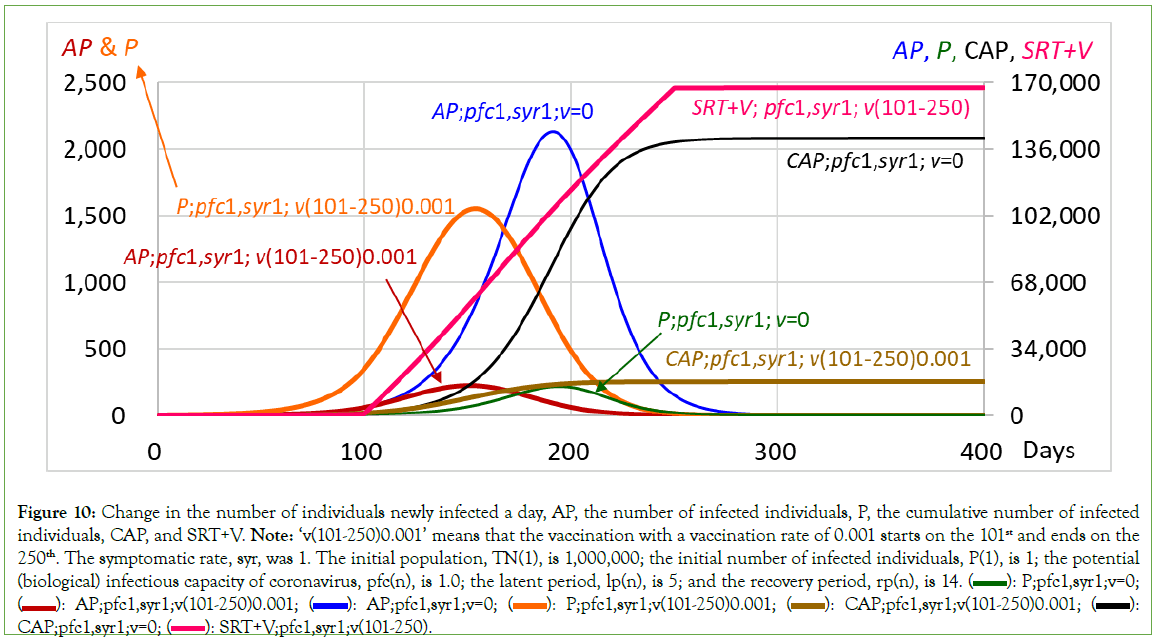
Figure 10: Change in the number of individuals newly infected a day, AP, the number of infected individuals, P, the cumulative number of infected individuals, CAP, and SRT+V. Note: ‘v(101-250)0.001’ means that the vaccination with a vaccination rate of 0.001 starts on the 101st and ends on the 250th. The symptomatic rate, syr, was 1. The initial population, TN(1), is 1,000,000; the initial number of infected individuals, P(1), is 1; the potential (biological) infectious capacity of coronavirus, pfc(n), is 1.0; the latent period, lp(n), is 5; and the recovery period, rp(n), is 14.  P;pfc1,syr1;v=0;
  CAP;pfc1,syr1;v=0;
  SRT+V;pfc1,syr1;v(101-250).
| v(101-xx); | Infected/day:AP | Infected:P | On date xx | Total on the end date of P | |||||||||
|---|---|---|---|---|---|---|---|---|---|---|---|---|---|
| 0.01;xx | Date of peak | Number | Date of end | Date of peak | Number | Date of end | AP | P | SRT+V | CAP | SRT+V | TI (Total Infection) | Δ Infection/day |
| 300 | 150-152 | 223 | 259 | 153-154 | 1556 | 279 | 0 | 0 | 217247 | 17247 | 217247 | 17247 | 0 |
| 250 | 150-153 | 223 | 259 | 153-155 | 1556 | 282 | 0 | 0 | 167197 | 17236 | 167248 | 17248 | 0.3 |
| 200 | 150-154 | 223 | 290 | 153-156 | 1556 | 320 | 59 | 485 | 116383 | 16387 | 117470 | 17270 | 5.8 |
| 180 | 150-155 | 223 | 340 | 153-157 | 1556 | 396 | 139 | 1068 | 91951 | 14486 | 98550 | 18550 | 14.2 |
| 170 | 150-156 | 223 | 388 | 153-158 | 1556 | 459 | 182 | 1348 | 79843 | 12897 | 90281 | 20281 | 27.5 |
| 160 | 150-157 | 223 | 455 | 153-159 | 1556 | 543 | 213 | 1524 | 67625 | 10925 | 84216 | 24218 | 46.9 |
| cf; v=0 | 191-192 | 2135 | 326 | 194 | 14895 | 342 | 194th | 14895 | 52280 | 83348 | 141785 | 141785 | |
Table 3: Comparison of the number of ‘infected/day; AP’, ‘infected; P’, ‘recovered +vaccinated; SRT+V’ and ‘the total number of infected individuals; TI’ among those calculated according to different dates at the end of vaccination. Note: SRT: Cumulative number of recovered individuals; V: Cumulative number of vaccinated individuals; CAP: Cumulative number of infected individuals. ‘v(101-xx); 0.001’ : Vaccination with a vaccination rate of 0.001 starts on the 101st and ends on date xx. The ‘194th; 14,895; 52,280; 83,348’ in the ‘cf; v=0’ line: Number of infected individuals (P) is 14,895, SRT+V: 52,280; CAP: 83,348 on the 194th, which is the date of the peak of P for the case without vaccination. The symptomatic rate, syr, was 1. Initial population, TN(1): 1,000,000; Initial number of infected individuals, P(1): 1; Potential (biological) infectious capacity of coronavirus, pfc(n): 1.0; Latent period, lp(n): 5; Recovery period, rp(n): 14.
From the viewpoint of ‘herd immunity’, the cumulative number of infected individuals at the peak for P, which is the turning point at which the number of infected individuals changes from increasing to decreasing, is one of the ‘expedient and/or purposeful herd immunity thresholds’ for a given case. Namely, the cumulative number of 83,348 could be an ‘expedient herd immunity threshold’ for a case in which the potential (biological) infectious capacity of coronavirus, pfc(n), is 1.0 and the symptomatic rate is 1.0.
When vaccination at a rate of 0.001 starts on the 101st and ends on the 250th, expressed as ‘v(101-250)0.001’ in Figure 10, meaning that the number of vaccinated individuals increases 1,000 a day during the period from the 101st to the 250th, the number of individuals newly infected a day, AP, reaches 223 at the peak from the 150th to 152nd and then decreases to 0 on the 259th. The number of infected individuals, P, reaches 1,556 at the peak on the 153rd and 154th days and then decreases to 0 on the 282nd day, with a total number of infected individuals of 17,248. In the case of ‘v (101-250)0.001’, the SRT+V at the end of vaccination, that is, on the 250th, became 167,197, exceeding the expedient herd immunity threshold of 83,348; these results are similar to those obtained for ‘v(101-300)0.001’, which had a sufficiently long duration of mass vaccination (Table 3). It was clearly shown that vaccination significantly decreased the number of infected individuals from 141,785 in the case without vaccination to 17,248 (Table 3 and Figure 10).
On the other hand, when vaccination at a rate of 0.001 starts on the 101st and ends on the 170th, expressed as ‘v(101-170)0.001’, meaning that the number of vaccinated individuals increases 1,000 a day during the period from the 101st to the 170th, the number of individuals newly infected a day, AP, reaches 223 at the peak from the 150th to the 152nd and then decreases to 0 on the 388th. The number of infected individuals, P, reaches 1,556 at the peak on the 153rd and the 154th and then decreases to 0 on the 459th, with a total number of infected individuals of 20,281. At the end of vaccination, that is, on the 170th, the SRT+V were 79,843, which was less than the expedient herd immunity threshold of 83,348. It is clear that when the SRT+V at the end of vaccination is less than the expedient herd immunity threshold, the number of infected individuals considerably increases, from 17,248 to 20,281, and the duration of infection is markedly prolonged, from 282 days to 459 days, compared to that in the case of ‘v (101-250)0.001’ (Table 3 and Figure 11).
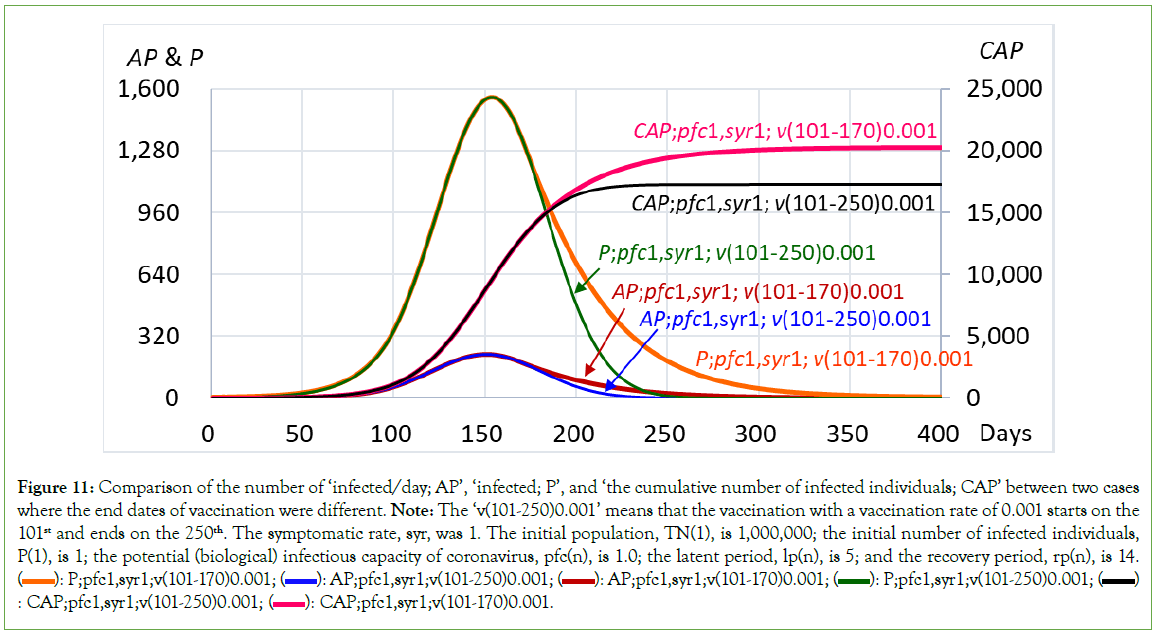
Figure 11: Comparison of the number of ‘infected/day; AP’, ‘infected; P’, and ‘the cumulative number of infected individuals; CAP’ between two cases where the end dates of vaccination were different. Note: The ‘v(101-250)0.001’ means that the vaccination with a vaccination rate of 0.001 starts on the 101st and ends on the 250th. The symptomatic rate, syr, was 1. The initial population, TN(1), is 1,000,000; the initial number of infected individuals, P(1), is 1; the potential (biological) infectious capacity of coronavirus, pfc(n), is 1.0; the latent period, lp(n), is 5; and the recovery period, rp(n), is 14.  P;pfc1,syr1;v(101-250)0.001;
  : CAP;pfc1,syr1;v(101-250)0.001;
  CAP;pfc1,syr1;v(101-170)0.001.
Changes in the date of the end of infection, ‘Date’, and in the total number of infected individuals, TI, with a change in the date at the end of vaccination, ‘DEV’, for the cases where vaccination with a vaccination rate of 0.001 starts on the 101st are shown in Table 3 and Figure 12. As previously mentioned, when the duration of mass vaccination is shortened, the number of infected individuals considerably increases, and the duration of infection is markedly prolonged. Especially when vaccination is stopped on the 170th, meaning that vaccination is stopped before the SRT+V reaches the expedient herd immunity threshold, the total number of infected individuals is 20,281, which is significantly less than that in the case without vaccination, that is, 141,785. However, the duration of infection, 459 days, became significantly longer than 342 days in the case without vaccination, suggesting that the probability of occurrence of new strains and/or variants and breakthrough infection could be high. Conversely, when vaccination is continued up to the 180th, meaning that vaccination is stopped after the SRT+V has exceeded the expedient herd immunity threshold, the total number of infected individuals is considerably reduced, approaching the final number of infected individuals expected for the case with a sufficient number of vaccinated individuals, and the duration of infection is markedly shortened, although when vaccination is continued until the 300th, the day when the number of infected individuals (P) becomes 0, the effect of vaccination could be maximized (Table 3). In addition, as noted for the cases in which the symptomatic rate is set to 0 and vaccination at a rate of 0.01 starts on the 51st, even though the number of individuals newly infected a day, AP, changes from increasing to decreasing on the 152nd, vaccination should not be stopped but rather continued.
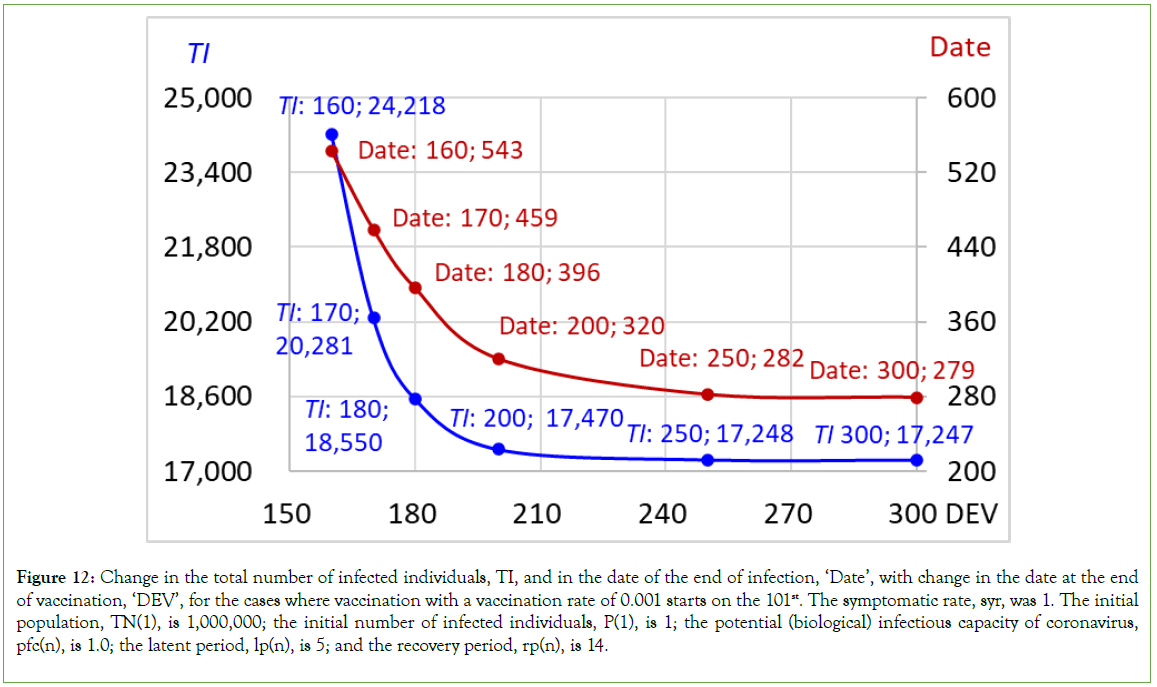
Figure 12: Change in the total number of infected individuals, TI, and in the date of the end of infection, ‘Date’, with change in the date at the end of vaccination, ‘DEV’, for the cases where vaccination with a vaccination rate of 0.001 starts on the 101st. The symptomatic rate, syr, was 1. The initial population, TN(1), is 1,000,000; the initial number of infected individuals, P(1), is 1; the potential (biological) infectious capacity of coronavirus, pfc(n), is 1.0; the latent period, lp(n), is 5; and the recovery period, rp(n), is 14.
Variations in infections and duration: Symptomatic rate 1, started on day 51
When vaccination at a rate of 0.001 starts on the 51st and ends on the 200th, expressed as ‘v (51-200)0.001’, meaning that the number of vaccinated individuals increases 1,000 a day during the period from the 51st to the 200th, the number of individuals newly infected a day, AP, reaches 18 at the peak from the 98th to the 116th and then decreases to 0 on the 195th. The number of infected individuals, P, reaches 128 at the peak on the 110th and then decreases to 0 on the 221st, with a total number of infected individuals of 1,513. The total number of infected individuals, TI, 1,513, greatly decreased from 141,785 in the case without vaccination (Table 4 and Figure 13). It is clearly shown that the vaccination starting on the 51st and ending on the 200th induces a marked decrease in the number of infected individuals even compared to the case where the vaccination with the same vaccination rate starts on the 101st and ends on the 200th, 17,470 (Table 3).
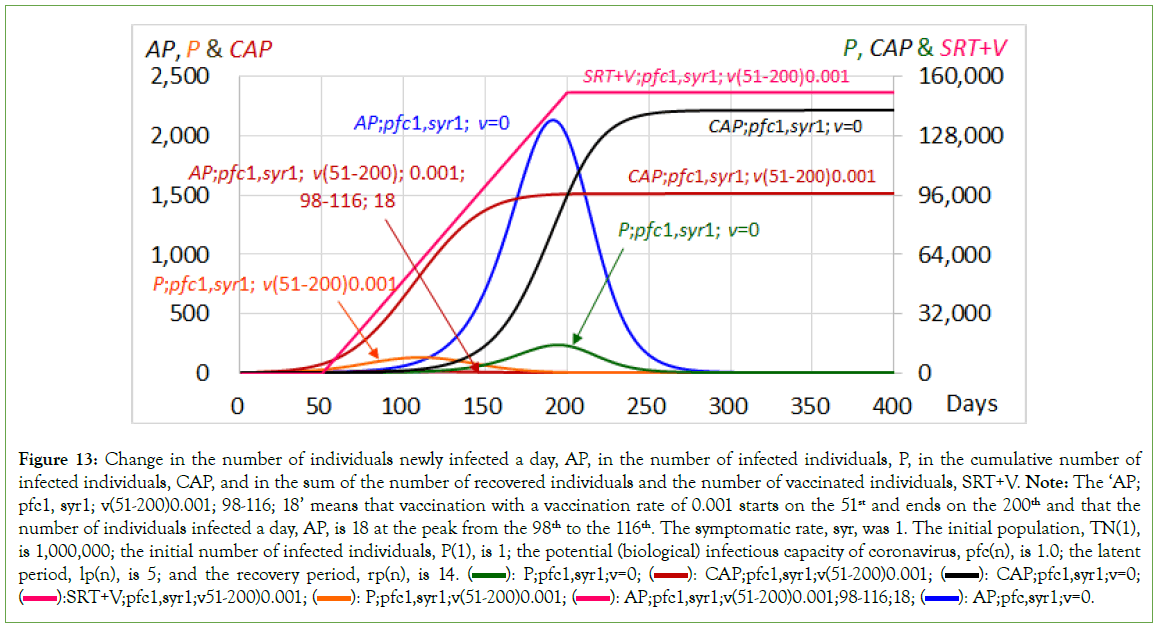
Figure 13: Change in the number of individuals newly infected a day, AP, in the number of infected individuals, P, in the cumulative number of
infected individuals, CAP, and in the sum of the number of recovered individuals and the number of vaccinated individuals, SRT+V. Note: The ‘AP; pfc1, syr1; v(51-200)0.001; 98-116; 18’ means that vaccination with a vaccination rate of 0.001 starts on the 51st and ends on the 200th and that the number of individuals infected a day, AP, is 18 at the peak from the 98th to the 116th. The symptomatic rate, syr, was 1. The initial population, TN(1), is 1,000,000; the initial number of infected individuals, P(1), is 1; the potential (biological) infectious capacity of coronavirus, pfc(n), is 1.0; the latent period, lp(n), is 5; and the recovery period, rp(n), is 14.  CAP;pfc1,syr1;v=0;
  AP;pfc1,syr1;v(51-200)0.001;98-116;18;
  AP;pfc,syr1;v=0.
| v(51-xx); | Infected/day:AP | Infected:P | On date xx | Total on the end date of P | |||||||||
|---|---|---|---|---|---|---|---|---|---|---|---|---|---|
| 0.01;xx | Date of peak | Number | Date of end | Date of peak | Number | Date of end | AP | P | SRT+V | CAP | SRT+V | TI (Total Infection) | Δ Infection/day |
| 300 | 98-116 | 18 | 195 | 110 | 128 | 220 | 0 | 0 | 251512 | 1512 | 251512 | 1512 | 0 |
| 200 | 98-117 | 18 | 195 | 110 | 128 | 221 | 0 | 3 | 151500 | 1509 | 151513 | 1513 | 1 |
| 150 | 98-118 | 18 | 221 | 110 | 128 | 274 | 8 | 61 | 101222 | 1373 | 101569 | 1569 | 1.06 |
| 130 | 98-119 | 18 | 293 | 110 | 128 | 389 | 14 | 106 | 80913 | 1155 | 81844 | 1844 | 2.39 |
| 120 | 98-120 | 18 | 416 | 110 | 128 | 578 | 17 | 122 | 70732 | 999 | 72449 | 2449 | 3.2 |
| cf; v=0 | 191-192 | 2135 | 326 | 194 | 14895 | 342 | 194th | 14895 | 52280 | 83348 | 141785 | 141785 | |
Table 4: Comparison of the number of ‘infected/day; AP’, ‘infected; P’, ‘recovered +vaccinated; SRT+V’ and ‘the total number of infected individuals; TI’ among those calculated according to different dates at the end of vaccination. Note: SRT: Cumulative number of recovered individuals; V: Cumulative number of vaccinated individuals; CAP: Cumulative number of infected individuals. The ‘v(51-xx);0.001’: Vaccination with a vaccination rate of 0.001 starts on the 51st and ends on date xx. The ‘194th; 14,895; 52,280; 83,348’ in the ‘cf; v=0’ line: Number of infected individuals (P): 14,895, SRT+V: 52,280; Cumulative number of infected individuals, CAP: 83,348 on the 194th, which is the date of the peak of P. The symptomatic rate, syr, was 1. The initial population, TN(1): 1,000,000; Initial number of infected individuals, P(1): 1; Potential (biological) infectious capacity of coronavirus, pfc(n): 1.0; Latent period, lp(n): 5; Recovery period, rp(n): 14.
On the other hand, when vaccination at a rate of 0.001 starts on the 51st and ends on the 120th, expressed as ‘v(51-120)0.001’, meaning that the number of vaccinated individuals increases 1,000 a day during the period from the 51st to the 120th, the number of individuals newly infected a day, AP, reaches 18 at the peak from the 98th to the 116th and then decreases to 0 on the 416th. The number of infected individuals, P, reaches 128 at the peak on the 110th and then decreases to 0 on the 578th, with a total number of infected individuals of 2,449. The SRT+V on the 120th, the date at the end of vaccination, were 70,732 and were less than the expedient herd immunity threshold of 83,348. Thus, the SRT+V on the date of the end of vaccination was less than the expedient herd immunity threshold, the number of infected individuals considerably increased, and the duration of infection was markedly prolonged compared to that in the case where vaccination with the same vaccination rate started on the 51st and ended on the 200th (Table 4 and Figure 14).
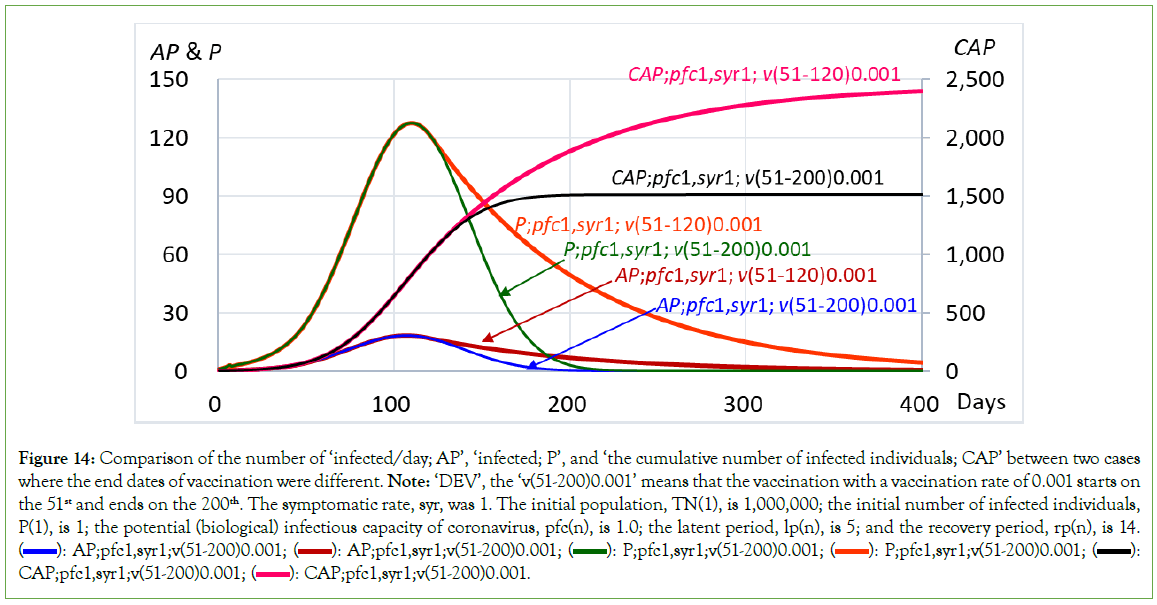
Figure 14: Comparison of the number of ‘infected/day; AP’, ‘infected; P’, and ‘the cumulative number of infected individuals; CAP’ between two cases where the end dates of vaccination were different. Note: ‘DEV’, the ‘v(51-200)0.001’ means that the vaccination with a vaccination rate of 0.001 starts on the 51st and ends on the 200th. The symptomatic rate, syr, was 1. The initial population, TN(1), is 1,000,000; the initial number of infected individuals, P(1), is 1; the potential (biological) infectious capacity of coronavirus, pfc(n), is 1.0; the latent period, lp(n), is 5; and the recovery period, rp(n), is 14.  P;pfc1,syr1;v(51-200)0.001;
  CAP;pfc1,syr1;v(51-200)0.001;
  CAP;pfc1,syr1;v(51-200)0.001.
Changes in the date of the end of infection, ‘Date’, and in the total number of infected individuals, TI, with the change in the date at the end of vaccination, ‘DEV’, for the cases where vaccination with a vaccination rate of 0.001 starts on the 51st are shown in Table 4 and Figure 15.
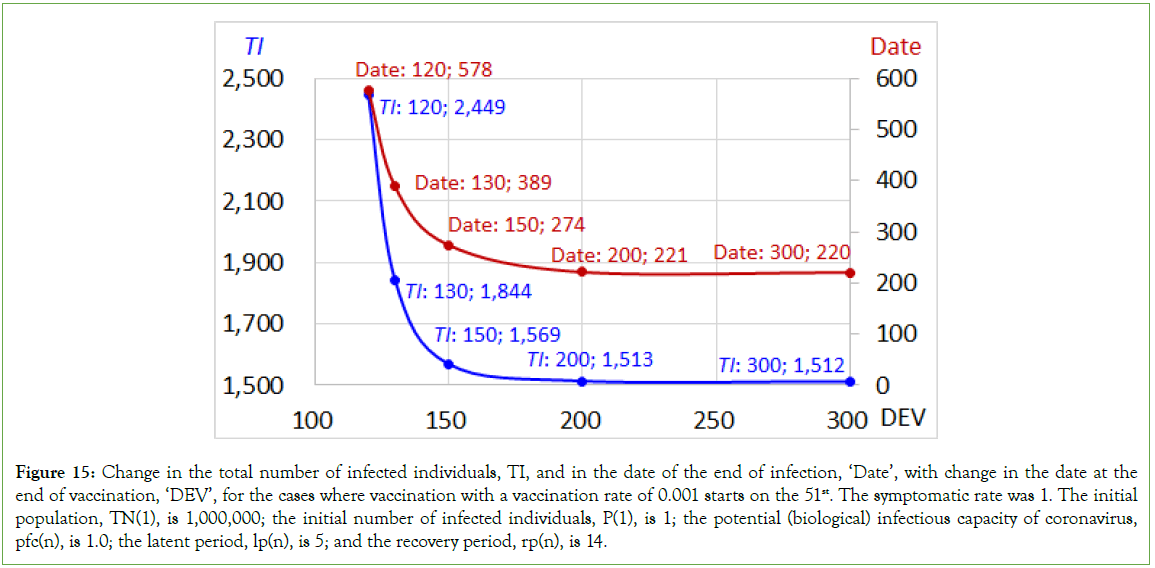
Figure 15: Change in the total number of infected individuals, TI, and in the date of the end of infection, ‘Date’, with change in the date at the end of vaccination, ‘DEV’, for the cases where vaccination with a vaccination rate of 0.001 starts on the 51st. The symptomatic rate was 1. The initial population, TN(1), is 1,000,000; the initial number of infected individuals, P(1), is 1; the potential (biological) infectious capacity of coronavirus, pfc(n), is 1.0; the latent period, lp(n), is 5; and the recovery period, rp(n), is 14.
As previously mentioned, when the mass vaccination duration is shortened, the number of infected individuals considerably increases, and the duration of infection is markedly prolonged. Especially when vaccination is stopped on the 130th, meaning that vaccination is stopped before the SRT+V has reached the expedient herd immunity threshold, the total number of infected individuals (1,844) markedly increases to greater than the 1,569 of the cases where vaccination is stopped on the 150th, and the duration of infection (389 days) is significantly longer than the 274 days when vaccination is stopped on the 150th, suggesting that the probability of occurrence of new strains and/or variants could be high, although the total number of infected individuals is significantly less than that of the case without vaccination; 141785. Conversely, when vaccination is continued up to the 150th day, meaning that vaccination is stopped after SRT+V exceeds the expedient herd immunity threshold, the total number of infected individuals is considerably reduced, approaching the final number of infected individuals expected for the case with a sufficient number of vaccinated individuals, and the duration of infection is markedly shortened. However, when vaccination is continued until the 300th day, the day when the number of infected individuals (P) becomes 0, the vaccination achieves its maximum effect. In addition, as noted for the cases where the symptomatic rate is set to 0 and vaccination with a vaccination rate of 0.01 starts on the 51st, even though the number of individuals newly infected a day, AP, changes from increasing to decreasing on the 116th, vaccination should not be stopped but rather be continued.
Furthermore, when vaccination at a rate of 0.001 starts on the 201st and ends on the 300th, expressed as ‘v (201-300)0.001’, the number of vaccinated individuals increases 1,000 a day during the period from the 201st to the 300th, indicating that vaccination starts after the peak for P. The number of individuals newly infected a day, AP, reaches 2,135 at the peak on the 191st and the 192nd and then decreases to 0 on the 285th. The number of infected individuals, P, reaches 14,895 at the peak on the 194th and then decreases to 0 on the 300th, with a total number of infected individuals of 133,198 (Table 5 and Figure 16). Similarly, for ‘v (201-400)0.001’, the results are similar, although the total number of vaccinated individuals increases. Although the total number of infected individuals, TI, is significantly greater than that when the vaccination starts on the 101st and/or on the 51st, it is 6% less than that in the case without vaccination (141.785). The duration of infection is shortened by approximately one and a half months, from 342 days to 300 days, or approximately 12%. A shortened duration of infection decreases the probability of occurrence of new strains and/or variants and breakthrough infection. Thus, it is not that vaccination with a late start is of no effect; vaccination would be best as soon as possible.
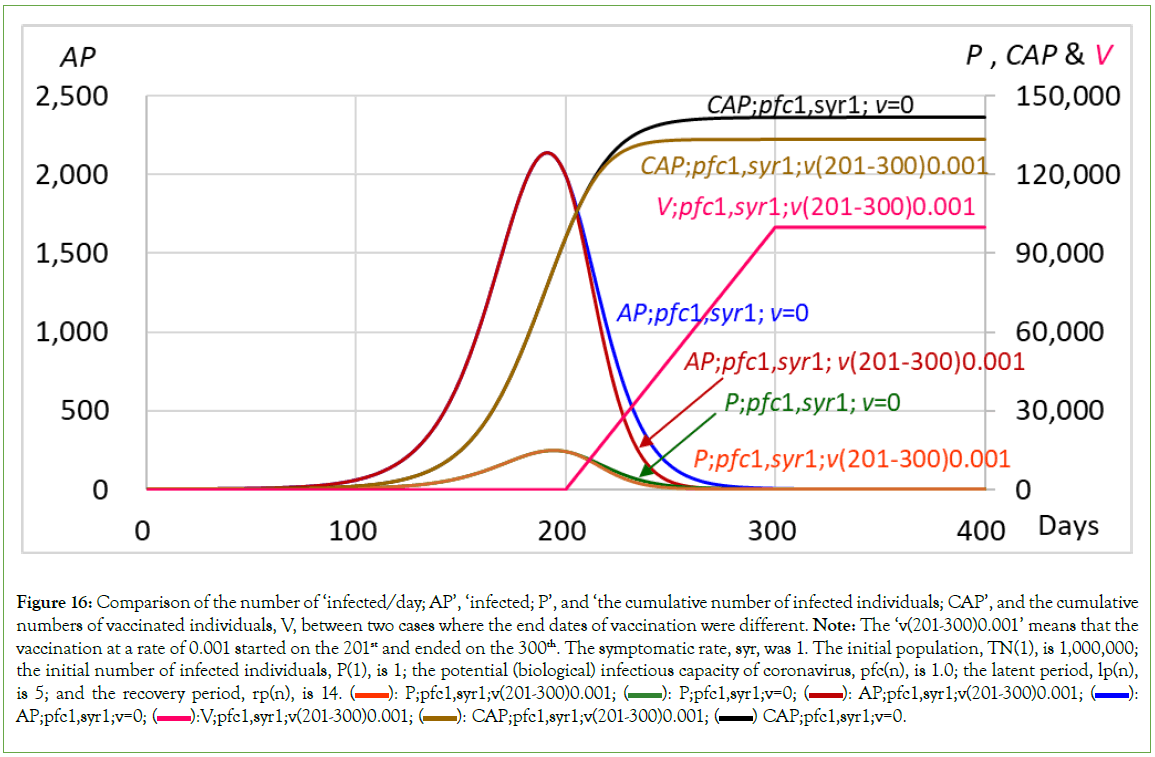
Figure 16: Comparison of the number of ‘infected/day; AP’, ‘infected; P’, and ‘the cumulative number of infected individuals; CAP’, and the cumulative numbers of vaccinated individuals, V, between two cases where the end dates of vaccination were different. Note: The ‘v(201-300)0.001’ means that the vaccination at a rate of 0.001 started on the 201st and ended on the 300th. The symptomatic rate, syr, was 1. The initial population, TN(1), is 1,000,000; the initial number of infected individuals, P(1), is 1; the potential (biological) infectious capacity of coronavirus, pfc(n), is 1.0; the latent period, lp(n), is 5; and the recovery period, rp(n), is 14.  AP;pfc1,syr1;v(201-300)0.001;
  AP;pfc1,syr1;v=0;
  CAP;pfc1,syr1;v=0.
| syr=1 | Infected/day:AP | Infected:P | Total | ||||||||||
|---|---|---|---|---|---|---|---|---|---|---|---|---|---|
| v | Date of peak | Number | CAP | Date of end | Date of peak | Number | SRT+V | CAP | Date of end | V | SRT+V | TI (Total Infection) | RM |
| v=0 | 191 | 2135 | 76961 | 326 | 194 | 14895 | 52280 | 83348 | 342 | 0 | 141785 | 141785 | 858215 |
| 192 | 79096 | ||||||||||||
| v(201-300)0.001 | 191 | 2135 | 79096 | 326 | 194 | 14895 | 52280 | 83348 | 300 | 100000 | 233198 | 133198 | 766802 |
| 192 | 79096 | ||||||||||||
| v(201-400)0.001 | 191 | 2135 | 79096 | 326 | 194 | 14895 | 52280 | 83348 | 300 | 200000 | 333195 | 133198 | 666802 |
| 192 | 79096 | ||||||||||||
Table 5: Comparison of the number of ‘infected/day; AP’, ‘infected; P’, ‘recovered +vaccinated; SRT+V’ and ‘the total number of infected individuals; TI’ between those calculated in the cases with different dates at the end of vaccination. SRT is the cumulative number of recovered individuals, V is the cumulative number of vaccinated individuals, CAP is the cumulative number of individuals infected, and RM is the number of susceptible individuals remaining in the community. The ‘v(201-300);0.001’ means that the vaccination with a vaccination rate of 0.001 starts on the 201st and ends on the 300th. The symptomatic rate was 1. The initial population, TN(1), is 1,000,000; the initial number of infected individuals, P(1), is 1; the potential (biological) infectious capacity of coronavirus, pfc(n), is 1.0; the latent period, lp(n), is 5; and the recovery period, rp(n), is 14.
Vaccination start date impact on the 101st day: Symptomatic rate 0.8
When the symptomatic rate is set to 0.8, 80% of the individuals infected on a day become symptomatic on the day after the end of the latent period, and they are isolated from the community on the next day. The isolated individuals returned to the community as ‘recovered individuals’ after the end of the isolation period. However, 20% of the individuals infected on the day do not become symptomatic even after the latent period. They are asymptomatic through the infectious period (the recovery period), are not isolated and stay in the community. After the recovery period, they become ‘recovered individuals’ who have immunity in the community.
For the community in which the initial population (TN(1)) is 1,000,000 and under the condition that the initial number of infected individuals, P(1), is 1, the potential (biological) infectious capacity of coronavirus, pfc(n), is 1.0, the latent period, lp(n), is 5, and the recovery period, rp(n), is 14. The symptomatic rate, syr, was 0.8. When the vaccination rate is 0 through the simulation, the number of individuals newly infected a day (AP) reaches 8,670 at the peak on the 125th and then decreases to 0 on the 217th. The number of infected individuals, P, reaches 73,678 at the peak on the 129th, with a cumulative number of 218,219. After the peak, the number of infected individuals decreased to 0 on the 240th, with a total number of infected individuals of 336,096 (Table 6 and Figure 17). As noted by Ohmori (2023) [2], the total number of infected individuals, TI, 336,096, was significantly greater than the 141,785 in the cases where the symptomatic rate was 1 (Table 6 and Figure 17), although it was remarkably less than the 598,287 in the cases where the symptomatic rate was 0 (Table 6). The cumulative number of infected individuals, 218,219 at the peak for P on the 129th, could be an expedient herd immunity threshold.
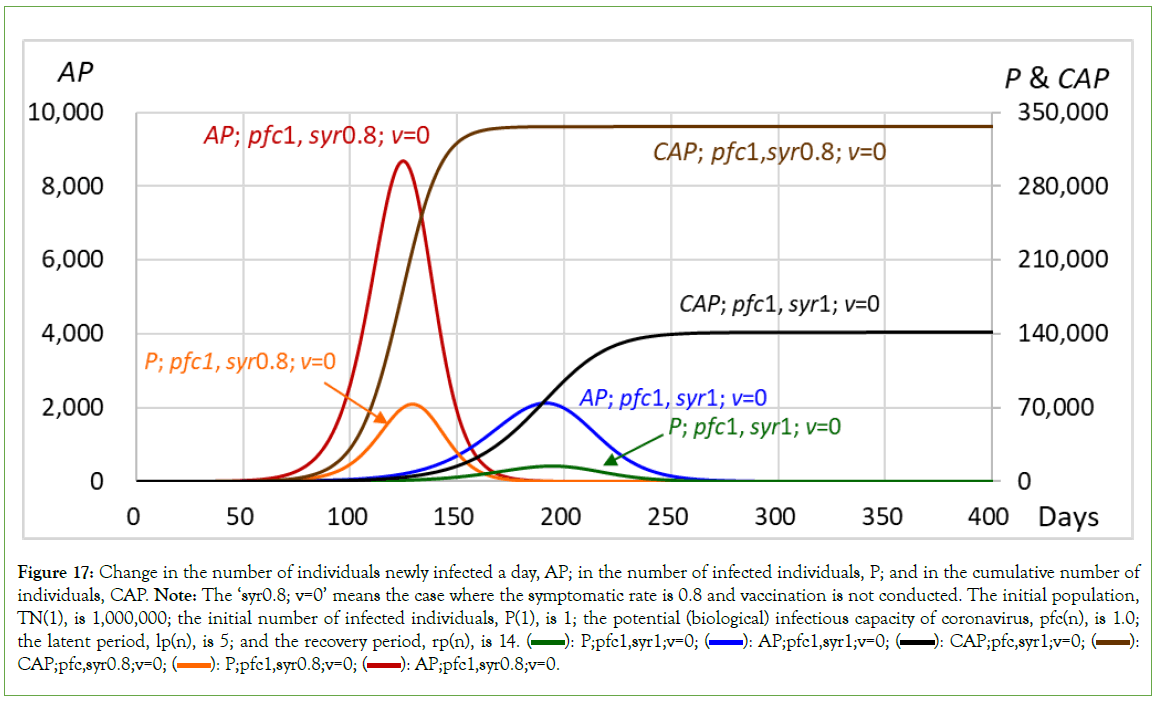
Figure 17: Change in the number of individuals newly infected a day, AP; in the number of infected individuals, P; and in the cumulative number of individuals, CAP. Note: The ‘syr0.8; v=0’ means the case where the symptomatic rate is 0.8 and vaccination is not conducted. The initial population, TN(1), is 1,000,000; the initial number of infected individuals, P(1), is 1; the potential (biological) infectious capacity of coronavirus, pfc(n), is 1.0; the latent period, lp(n), is 5; and the recovery period, rp(n), is 14.  CAP;pfc,syr0.8;v=0;
  AP;pfc1,syr0.8;v=0.
| v(101-xx); | Infected/day:AP | Infected:P | On date xx | Total on the end date of P | ||||||||||
|---|---|---|---|---|---|---|---|---|---|---|---|---|---|---|
| 0.01;xx | Date of peak | Number | Date of end | Date of peak | Number | Date of end | AP | P | SRT+V | CAP | SRT+V | TI (Total Infection) | Δ Infection/day | Δ During/day |
| 300 | 122 | 7099 | 207 | 127 | 60392 | 227 | 0 | 0 | 477559 | 277559 | 477559 | 277559 | 0 | 0 |
| 240 | 122 | 7099 | 207 | 127 | 60392 | 227 | 0 | 0 | 417559 | 277559 | 417559 | 277559 | 0 | 0 |
| 230 | 122 | 7099 | 207 | 127 | 60392 | 227 | 0 | 0 | 407558 | 277559 | 407559 | 277559 | 0 | 0 |
| 210 | 122 | 7099 | 207 | 127 | 60392 | 227 | 0 | 6 | 387543 | 277557 | 387559 | 277559 | 0 | 0 |
| 200 | 122 | 7099 | 207 | 127 | 60392 | 228 | 1 | 30 | 377479 | 277551 | 377559 | 277559 | 0 | -0.1 |
| 180 | 122 | 7099 | 209 | 127 | 60392 | 231 | 26 | 513 | 356180 | 277392 | 357568 | 277568 | 3 | -0.15 |
| 170 | 122 | 7099 | 211 | 127 | 60392 | 233 | 103 | 1926 | 342396 | 276866 | 347597 | 277597 | 15 | -0.2 |
| 150 | 122 | 7099 | 216 | 127 | 60392 | 240 | 1245 | 18741 | 277875 | 267914 | 328180 | 278180 | 83 | -0.35 |
| 140 | 122 | 7099 | 220 | 127 | 60392 | 244 | 3315 | 40530 | 208607 | 247302 | 319779 | 279779 | 400 | -0.4 |
| 130 | 192 | 7099 | 223 | 127 | 60392 | 248 | 6126 | 58907 | 129464 | 201213 | 314435 | 284436 | 1164 | -0.4 |
| syr0.8; v=0 | 125 | 8670 | 217 | 129 | 73678 | 240 | 129th | 73678 | 95885 | 218219 | 336096 | 336096 | ||
| syrl; v=0 | 191-192 | 2135 | 326 | 194 | 14895 | 342 | 194th | 14895 | 52280 | 83348 | 141785 | 141785 | ||
Table 6: Comparison of the number of ‘infected/day; AP’, ‘infected; P’, ‘recovered +vaccinated; SRT+V’ and ‘the total number of infected individuals; TI’ among those calculated in the cases with different dates at the end of vaccination. Note: SRT: Cumulative number of recovered individuals; V: Cumulative number of vaccinated individuals; CAP: Cumulative number of infected individuals. The ‘v(101-xx);0.001’: Vaccination with a vaccination rate of 0.001 starts on the 101st and ends on date xx. The ‘129th; 73,678; 95,885, 218,219’ in the ‘syr0.8; v=0’ line: Number of infected individuals, P: 73,678; SRT+V: 95,885; Cumulative number of infected individuals, CAP: 218,219 on the 129th, which is the date of the peak for P. The symptomatic rate, syr, was 0.8. The initial population, TN(1): 1,000,000; Initial number of infected individuals, P(1): 1; Potential (biological) infectious capacity of coronavirus, pfc(n): 1.0; Latent period, lp(n): 5; Recovery period, rp(n),: 14.
For the cases in which the symptomatic rate was 0.8 and the vaccination at a rate of 0.001 started on the 101st, the number of infected/day, AP, infected; P, recovered+vaccinated; SRT+V, and the total number of infected individuals; and TI’, are shown in Table 6, for different durations of vaccination. When vaccination at a rate of 0.001 starts on the 101st and ends on the 230th, expressed as ‘v (101-230)0.001’, meaning that the number of vaccinated individuals increases 1,000 a day during the period from the 101st to the 230th, the number of individuals newly infected a day, AP, reaches 7,099 at the peak on the 122nd and then decreases to 0 on the 207th. The number of infected individuals, P, reaches 60,392 at the peak on the 127th and then decreases to 0 on the 227th, with a total number of infected individuals of 277,559. The total number of infected individuals, TI, 277,559, decreased by approximately 20% from 336,096 in the case without vaccination (Table 6).
When vaccination at a rate of 0.001 starts on the 101st and ends on the 130th, expressed as ‘v (101-130)0.001’, the number of individuals newly infected a day, AP, reaches 7,099 at the peak on the 122nd and then decreases to 0 on the 223rd. The number of infected individuals, P, reaches 60,392 at the peak on the 127th and then decreases to 0 on the 248th, with a total number of infected individuals of 284,436.
As suggested by the large number of individuals infected a day, AP, at the peak; 7,099, overcoming the number of individuals vaccinated a day; 1,000, the value of CAP, which is induced mainly by the number of individuals infected by asymptomatic infected individuals staying in the community, exceeds the value of SRT+V for a long time during the first half of the duration of infection, as shown in Figure 18. Since the number of CAPs is greater than that of SRT+V in the long term, indicating that ‘recovered individuals’ are more effective than ‘vaccinated individuals’ at reducing the contact rate between infected individuals and susceptible individuals, the effect of vaccination itself and/or mass vaccination duration is not apparent in the number of infected individuals (Table 6 and Figure 19).
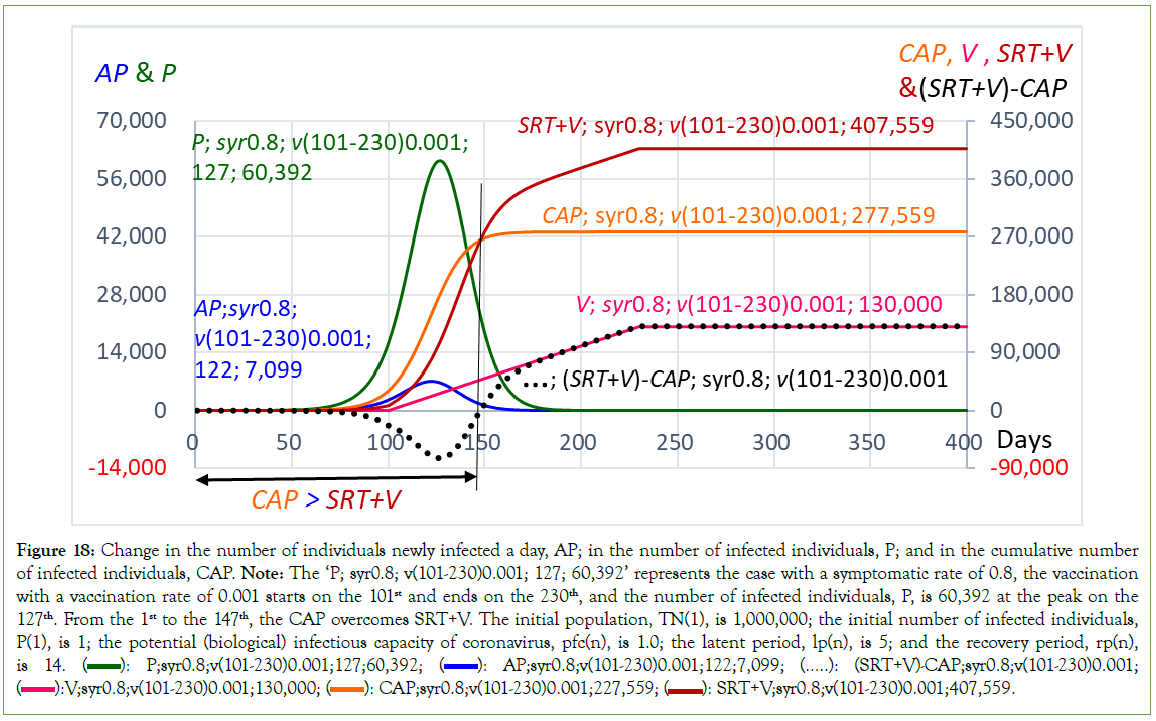
Figure 18: Change in the number of individuals newly infected a day, AP; in the number of infected individuals, P; and in the cumulative number
of infected individuals, CAP. Note: The ‘P; syr0.8; v(101-230)0.001; 127; 60,392’ represents the case with a symptomatic rate of 0.8, the vaccination with a vaccination rate of 0.001 starts on the 101st and ends on the 230th, and the number of infected individuals, P, is 60,392 at the peak on the 127th. From the 1st to the 147th, the CAP overcomes SRT+V. The initial population, TN(1), is 1,000,000; the initial number of infected individuals,
P(1), is 1; the potential (biological) infectious capacity of coronavirus, pfc(n), is 1.0; the latent period, lp(n), is 5; and the recovery period, rp(n), is 14.  P;syr0.8;v(101-230)0.001;127;60,392;
  AP;syr0.8;v(101-230)0.001;122;7,099; (…..): (SRT+V)-CAP;syr0.8;v(101-230)0.001;
  SRT+V;syr0.8;v(101-230)0.001;407,559.
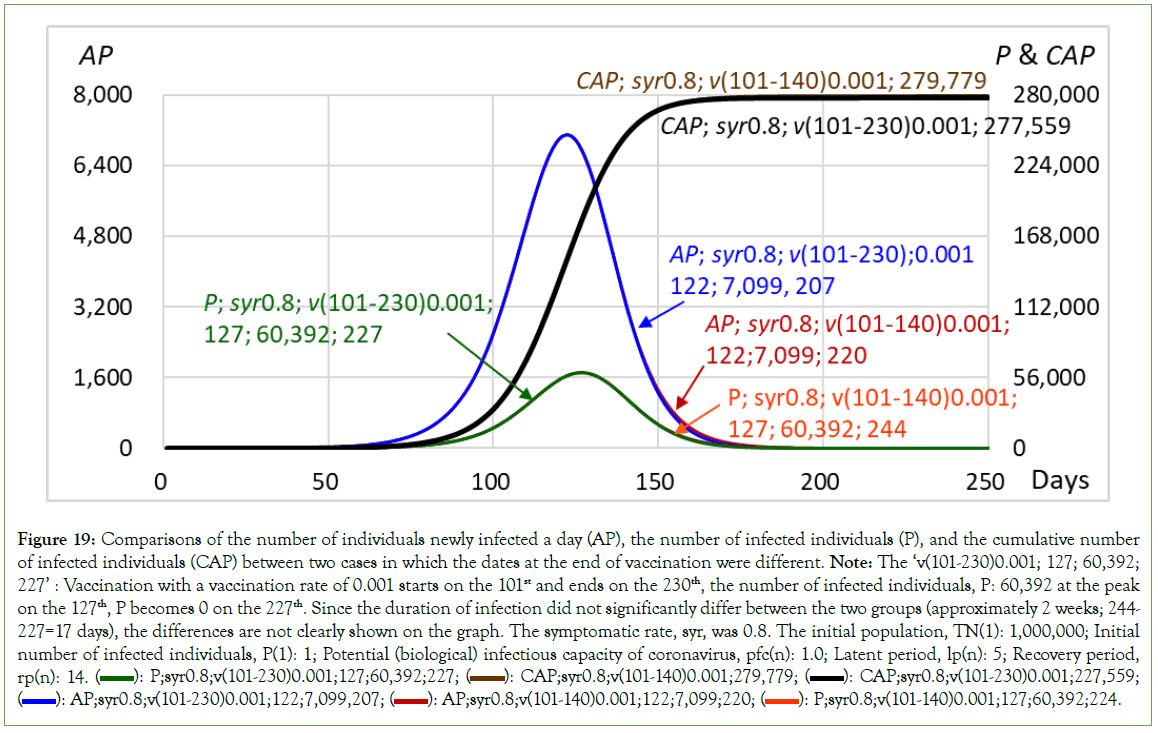
Figure 19: Comparisons of the number of individuals newly infected a day (AP), the number of infected individuals (P), and the cumulative number of infected individuals (CAP) between two cases in which the dates at the end of vaccination were different. Note: The ‘v(101-230)0.001; 127; 60,392; 227’ : Vaccination with a vaccination rate of 0.001 starts on the 101st and ends on the 230th, the number of infected individuals, P: 60,392 at the peak on the 127th, P becomes 0 on the 227th. Since the duration of infection did not significantly differ between the two groups (approximately 2 weeks; 244-227=17 days), the differences are not clearly shown on the graph. The symptomatic rate, syr, was 0.8. The initial population, TN(1): 1,000,000; Initial number of infected individuals, P(1): 1; Potential (biological) infectious capacity of coronavirus, pfc(n): 1.0; Latent period, lp(n): 5; Recovery period, rp(n): 14.  CAP;syr0.8;v(101-230)0.001;227,559;
  P;syr0.8;v(101-140)0.001;127;60,392;224.
On the other hand, when vaccination is stopped on the 150th, the SRT+V is 277,875 on the 150th, more than the expedient herd immunity threshold of 218,219; the increment of the number of infected individuals a day, ΔInf/day, which indicates an incident rate, is 83 (persons/day). When vaccination is stopped on the 140th, however, the SRT+V is 208,607 on the 140th, less than the expedient herd immunity threshold, ΔInf/day is 400 (persons/day), markedly becoming large. Thus, when vaccination is continued to the 150th, meaning that vaccination is stopped after SRT+V has exceeded the expedient herd immunity threshold, vaccination becomes more effective at reducing the incidence rate; however, when vaccination is continued until the 230th, the day when the number of infected individuals (P) reaches 0, the effect of vaccination could be maximized (Table 6 and Figure 19). In addition, as noted for the cases where the symptomatic rate is set to 0 and vaccination with a vaccination rate of 0.01 starts on the 51st, even though the number of individuals newly infected a day, AP, changes from increasing to decreasing on the 122nd, vaccination should not be stopped but rather continued seen in Figure 20.
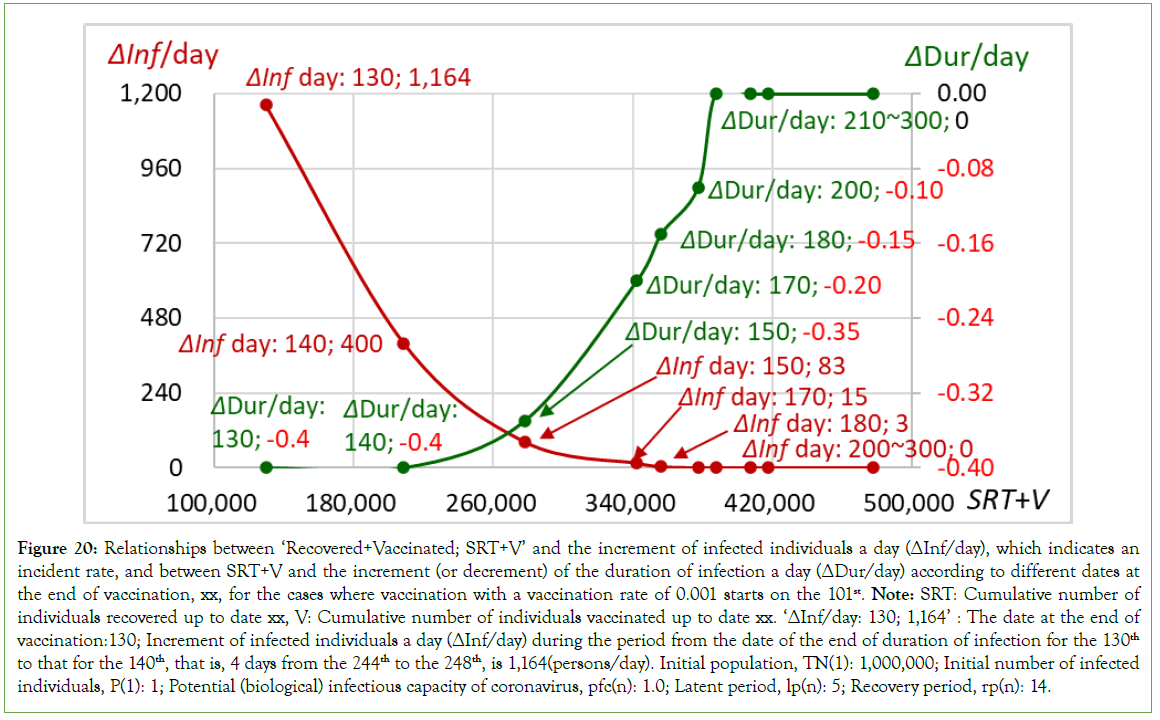
Figure 20: Relationships between ‘Recovered+Vaccinated; SRT+V’ and the increment of infected individuals a day (ΔInf/day), which indicates an incident rate, and between SRT+V and the increment (or decrement) of the duration of infection a day (ΔDur/day) according to different dates at the end of vaccination, xx, for the cases where vaccination with a vaccination rate of 0.001 starts on the 101st. Note: SRT: Cumulative number of individuals recovered up to date xx, V: Cumulative number of individuals vaccinated up to date xx. ‘ΔInf/day: 130; 1,164’ : The date at the end of vaccination:130; Increment of infected individuals a day (ΔInf/day) during the period from the date of the end of duration of infection for the 130th to that for the 140th, that is, 4 days from the 244th to the 248th, is 1,164(persons/day). Initial population, TN(1): 1,000,000; Initial number of infected individuals, P(1): 1; Potential (biological) infectious capacity of coronavirus, pfc(n): 1.0; Latent period, lp(n): 5; Recovery period, rp(n): 14.
On the one hand, vaccination causes a decrease in the number of susceptible individuals in the community, and on the other hand, it causes an increase in the number of individuals who are resistant to COVID-19 infection. Since vaccinated individuals live and work in the community, they reduce the contact rate between infected individuals and susceptible individuals. Namely, vaccination has direct and indirect effects on the spread of COVID-19, and the total number of vaccinated individuals practically controls the spread of COVID-19. Since the number of vaccinated individuals actually increases gradually daily according to the vaccination program, the total number of vaccinated individuals is determinedby the duration of mass vaccination. Using a flexible compartment model specific to COVID-19, the number of infected individuals was calculated according to different vaccination rates and different by the duration of mass vaccination. Using a flexible compartment model specific to COVID-19, the number of infected individuals was calculated according to different vaccination rates and different durations of mass vaccination, and the effect of mass vaccination duration on the spread of COVID-19 was evaluated based on the total number of infected individuals and the duration of infection.
A simulation/calculation was performed for the community with an initial population of the community, TN (1), of 1,000,000, and under the condition that the initial number of infected individuals, P(1), is 1, the potential (biological) infectious capacity of coronavirus, pfc(n), is 1.0, the latent period, lp(n), is 5, and the recovery period, rp(n), is 14. The results are summarized as follows:
1. When the symptomatic rate is set to 0, all the infected individuals are asymptomatic, are not symptomatic and are not isolated; thus, they stay in the community. They continue to infect susceptible individuals until the recovery period ends, after which they become recovered individuals who have immunity in the community. Even for this case, the number of infected individuals increases to a peak and then decreases. This phenomenon is explained by ‘herd immunity’, and the cumulative number of infected individuals at the peak, which is the turning point at which the number of infected individuals changes from increasing to decreasing, could be a hallmark of herd immunity, that is, a ‘herd immunity threshold’. For the case with a symptomatic rate of 0, when the vaccination rate is set to 0, the number of infected individuals reaches 336,268 at the peak on the 87th, with a cumulative number of 466,620, and then decreases to 0 on the 178th, with a total number of infected individuals of 598,287. The cumulative number of 466,620 could be a herd immunity threshold. For the cases where the symptomatic rate is set to 0 and vaccination with a vaccination rate of 0.01 starts on the 51st, when the vaccination ends on the 89th, meaning that the number of vaccinated individuals increases 10,000 a day during the period from the 51st to the 89th, the sum of the number of recovered individuals and the number of vaccinated individuals, SRT+V, on the 89th becomes 459,000, less than the herd immunity threshold, the total number of infected individuals becomes 115,030 and the increment of the number of infected individuals a day (ΔInf/day), which indicates an incident rate, is 161 (persons/day). The duration of infection was 193 days. When the vaccination ends on the 91st, however, the SRT+V on the 91st becomes 486,035, which is more than the herd immunity threshold; the total number of infected individuals becomes 113,580, and the ΔInf/day is 85 (persons/day). The duration of infection was 184 days. Although the difference in the date at the end of vaccination between the two groups was only 2 days, that is, the difference in the duration of mass vaccination between the two groups was only 2 days, significant differences were shown in the total number of infected individuals, in the increase in the number of infected individuals a day and in the duration of infection. The longer the mass vaccination duration is, the smaller the total number of infected individuals becomes; moreover, when the vaccination is continued until the day when the SRT+V exceeds the herd immunity threshold, the total number of infected individuals significantly decreases. It efficiently approaches the final number of infected individuals, 111,029, which is reached for the cases where vaccination is stopped on or after the 119th, although when vaccination is continued until the 150th, the day when the number of infected individuals becomes 0, the vaccination achieves its maximum effect. However, when vaccination is stopped before the date when SRT+V reaches the herd immunity threshold of 466,620, the vaccination is unable to achieve a sufficient effect. The number of individuals newly infected a day, AP, reaches a peak on the 71st and then decreases. The date of the peak, 71st, is fairly before the date when SRT+V reaches the herd immunity threshold. Thus, even if the number of individuals newly infected a day, which is usually announced, changes from increasing to decreasing, vaccination should not be stopped but rather be continued.
2. When the symptomatic rate is set to 1, all infected individuals become symptomatic after the latent period ends, and they are isolated from the community. When the isolation period ends, the isolated individuals become ‘recovered’ individuals who have immunity, after which they return to the community. In the case with a symptomatic rate of 1, when the vaccination rate is set to 0, the number of infected individuals reaches 14,895 at the peak on the 194th, with a cumulative number of infected individuals of 83,348, and then decreases to 0 on the 342nd, with a total number of infected individuals of 141,785. Since the cumulative number of infected individuals at the peak, which is the turning point at which the number of infected individuals changes from increasing to decreasing, could be a hallmark of herd immunity for a given case, the cumulative number of infected individuals of 83,348 could be an ‘expedient herd immunity threshold’. When vaccination at a rate of 0.001 starts on the 101st and ends on the 170th, meaning that the number of vaccinated individuals increases 1,000 a day during the period from the 101st to the 170th, the SRT+V on the 170th becomes 79,843, less than the expedient herd immunity threshold, 83,348, and the total number of infected individuals becomes 20,281. The duration of infection was 459 days. When vaccination is continued up to the 180th, the SRT+V on the 180th becomes 91,951, exceeding the expedient herd immunity threshold, and the total number of infected individuals becomes 18,550. The duration of infection was 396 days. For the latter case, the total number of infected individuals is considerably reduced with a remarkable shortening of the duration of infection. As previously noted, the longer the mass vaccination duration is, the smaller the total number of infected individuals becomes, and especially when the vaccination is continued until the day when the SRT+V exceeds the herd immunity threshold, the total number of infected individuals significantly decreases; however, when vaccination is continued until the 250th, the day when the number of infected individuals becomes 0, the vaccination has the full potential effect. In addition, even though the number of individuals newly infected a day changes from increasing to decreasing on the 152nd day, vaccination should not be stopped but rather continued.
3. When vaccination at a rate of 0.001 starts on the 51st and ends on the 120th, meaning that the number of vaccinated individuals increases 1,000 a day during the period from the 51st to the 120th, the SRT+V on the 120th becomes 70,732, being less than the expedient herd immunity threshold, and the total number of infected individuals becomes 2,449. The duration of infection was 578 days. On the other hand, when vaccination at a rate of 0.001 starts on the 51st and ends on the 200th, the SRT+V on the 200th becomes 151,500, which is considerably greater than the expedient herd immunity threshold of 83,348, and the total number of infected individuals becomes 1,513. The duration of infection was 221 days. For the latter case, both the total number of infected individuals and the duration of infection are significantly lower than those in the former case. Notably, compared with the total number of infected individuals (17,470) when vaccination at the same rate started on the 101st and ended on the 200th, the total number of infected individuals was markedly lower (1,513). Thus, with a vaccination rate of 0.001, the earlier the start date of vaccination is, the smaller the total number of infected individuals becomes. As previously noted, for the cases where vaccination at a rate of 0.001 starts on the 51st, it could also be said that the longer the mass vaccination duration is, the smaller the total number of infected individuals becomes. Especially when vaccination is stopped before the SRT+V reaches the expedient herd immunity threshold, the total number of infected individuals considerably increases, and the duration of infection is markedly prolonged. Additionally, when vaccination at a rate of 0.001 starts on the 201st, the total number of infected individuals becomes 133,198. This figure is less than that in the case without vaccination (141.785, 6%). The duration of infection is shortened by approximately one and a half months, from 342 days to 300 days, or approximately 12%. However, the total number of infected individuals is significantly greater than that when vaccination starts, even on the 101st and/or the 51st. Thus, it is not that vaccination with a late start is of no effect; vaccination would be best as soon as possible. In addition, even though the number of individuals newly infected a day changes from increasing to decreasing on the 116th day, vaccination should not be stopped but rather continued.
4. When the symptomatic rate is set to 0.8, 80% of the individuals infected on a day become symptomatic after the end of the latent period and are isolated from the community. The isolated individuals returned to the community as ‘recovered individuals’ after the end of the isolation period. The remaining 20% of the individuals infected on the day do not become symptomatic even after the latent period, are asymptomatic through the recovery period, are not isolated, and stay and continue infection in the community. After the recovery period, they become ‘recovered individuals’ in the community. For the case with a symptomatic rate of 0.8, when the vaccination rate is set to 0, the number of infected individuals reaches 73,678 at the peak on the 129th, with a cumulative number of 218,219, and then decreases to 0 on the 240th, with a total number of infected individuals of 336,096. It is clear that the total number of infected individuals is significantly greater than that in the case with a symptomatic rate of 1.0, that is, 141,785. The cumulative number of infected individuals at the peak, 218,219, could be an expedient herd immunity threshold for the given case. When vaccination at a rate of 0.001 starts on the 101st and ends on the 150th, the number of individuals newly infected a day reaches 7,099 at the peak on the 122nd and then decreases to 0 on the 216th. The number of infected individuals reaches 60,392 at the peak on the 127th and then decreases to 0 on the 240th, with a total number of infected individuals of 278,180. On the 150th day after the end of vaccination, the number of SRT+V individuals became 277,875, which was greater than the expedient herd immunity threshold. When vaccination is stopped on the 140th, however, the number of SRT+V individuals becomes 208,607 on the 140th, which is less than the expedient herd immunity threshold; the infection ends on the 244th, and the total number of infected individuals is 279,779, showing a slight increase compared to the case where vaccination is stopped on the 150th. As suggested by the large number of individuals infected a day at the peak, 7,099, overcoming the number of individuals vaccinated a day, 1,000, the number of CAPs is greater than that of SRT+V for the long term during the first half of the duration of infection, indicating that the ‘recovered individuals’ are more effective than the ‘vaccinated individuals’ at reducing the contact rate between infected individuals and susceptible individuals; thus, the effect of vaccination itself and/or mass vaccination duration is not apparent in the number of infected individuals. However, when vaccination is stopped on the 150th, the increment of the number of infected individuals a day, ΔInf/day, which indicates an incident rate, is 83 (persons/day); however, when vaccination is stopped on the 140th, ΔInf/day becomes 400 (persons/day), showing a marked increase from 83 to 400. Even for the cases in which the symptomatic rate is set to 0.8, when vaccination is continued until the date when the SRT+V exceeds the expedient herd immunity threshold, vaccination becomes more effective at reducing the incidence rate; however, when vaccination is continued until the day when the number of infected individuals becomes 0, the effect of vaccination could be maximized. In addition, even though the number of individuals newly infected a day changes from increasing to decreasing on the 122nd day, vaccination should not be stopped but rather continued.
As noted above, the number of infected individuals is markedly reduced, with a conspicuous decrease in the contact rate accelerated by an increase in the number of vaccinated individuals. Since the contact rate decreases with an increase in the number of vaccinated individuals, the earlier the start date of vaccination is, the smaller the total number of infected individuals becomes, and the longer the mass vaccination duration is, the smaller the total number of infected individuals becomes. The results also show that when vaccination is continued until the day when the sum of the number of recovered individuals and the number of vaccinated individuals exceeds an ‘expedient herd immunity threshold’, the total number of infected individuals is markedly reduced, and the duration of infection is also considerably shortened, as expected for the case with a sufficient mass vaccination duration, although when vaccination is continued until the day when the number of infected individuals reaches 0, the vaccination achieves its maximum effect. In addition, the number of individuals newly infected a day reaches a peak on the date fairly before the date when SRT+V reaches the herd immunity threshold and then decreases. Thus, even if the number of individuals newly infected a day changes from increasing to decreasing, vaccination should not be stopped but should be continued at least until the date when the SRT+V exceeds the herd immunity threshold.
Conclusion
In conclusion, our study utilized a flexible compartment model specific to COVID-19 to evaluate the impact of vaccination on the spread of the virus in a simulated community. The results highlight several key findings with implications for public health strategies and the ongoing global vaccination efforts.
Firstly, the concept of ‘herd immunity’ was explored, revealing that the cumulative number of infected individuals at the peak could serve as a potential benchmark or ‘herd immunity threshold.’ In scenarios where the symptomatic rate was set to 0, our simulations demonstrated that the cumulative number of 466,620 marked a notable herd immunity threshold. Vaccination, even when initiated at a later stage, significantly influenced the total number of infected individuals, emphasizing the importance of continued vaccination efforts.
Furthermore, our analysis illustrated the significant role of vaccination duration in shaping outcomes. Prolonged mass vaccination periods were associated with smaller total numbers of infected individuals. Notably, when vaccination continued until the sum of recovered and vaccinated individuals surpassed the herd immunity threshold, a substantial reduction in both the total number of infections and the duration of infection was observed.
Addressing different symptomatic rates, our study identified an ‘expedient herd immunity threshold’ for specific scenarios. Vaccination at a rate of 0.001 led to varying outcomes based on the start date and duration. An earlier start date correlated with smaller total numbers of infected individuals, reinforcing the importance of the timing of vaccination campaigns.
In cases where a portion of infected individuals remained asymptomatic and continued to infect the community, the study highlighted that the contact rate decreased with an increase in the number of vaccinated individuals. The findings underscored the efficacy of vaccination in reducing the overall incidence rate, with continued vaccination yielding optimal results.
In conclusion, our simulations consistently demonstrated that the cumulative number of infected individuals, the duration of vaccination campaigns, and the interplay between symptomatic and asymptomatic cases significantly influenced the outcomes of mass vaccination efforts. These insights provide valuable guidance for policymakers, public health officials, and healthcare practitioners involved in designing and implementing effective vaccination strategies to control the spread of COVID-19. As the global community continues to combat the pandemic, these findings contribute to the ongoing discourse on optimizing vaccination programs to achieve the desired public health outcomes.
Conflict of Interest
The author declares that he has no conflicts of interest.
Data Availability
The data will be made available upon reasonable request.
Author Information
ohmori@edu.k.u-tokyo.ac.jp
Funding
The author declares that no funds, grants, or other support was received during the preparation of this manuscript.
Acknowledgment
The author would like to thank Ms. Azumi Ohmori, MD, Assistant Director/Chief of Department of Obstetrics and Gynecology, Sakakibara Heart Institute, for the critical comments on the medical terms.
References
- Ohmori H. A flexible compartment model for simulation specific to COVID-19. J Infect Dis Ther. 2022;S5:001.
- Ohmori H. Effect of symptomatic rate on spreading of COVID-19 evaluated by a flexible compartment model. J Clin Res Bioeth. 2023;14:465.
- Public Health England. Duration of protection of COVID-19 vaccines against clinical disease. 2021.
- Katella K. How long will your coronavirus vaccination last? Yale medicine, doctors and advice, family health. 2021.
- Feikin DR, Higdon MM, Abu-Raddad LJ, Andrews N, Araos R, Goldberg Y, et al. Duration of effectiveness of vaccines against SARS-CoV-2 infection and COVID-19 disease: Results of a systematic review ad meta-regression. The Lancet. 2022;399(10328):924-944.
[Crossref] [Google Scholar] [PubMed]
- Andrews N, Tessier E, Stowe J, Gower C, Kirsebom F, Simmons R, et al. Duration of protection against mild and severe disease by COVID-19 vaccines. N Engl J Med. 2022;386(4):340-350.
[Crossref] [Google Scholar] [PubMed]
- Higdon MM, Baidya A, Walter KK, Patel MK, Issa H, Espie E, et al. Duration of effectiveness of vaccination against COVID-19 caused by the omicron variant. Lancet Infect Dis. 2022;(8):1114-1116.
[Crossref] [Google Scholar] [PubMed]
- Rennert L, Ma Z, McMahan CS, Dean D. Effectiveness and protection duration of COVID-19 vaccines and previous infection against any SARS-CoV-2 infection in young adults. Nat Commun. 2022;13(1):3946.
[Crossref] [Google Scholar] [PubMed]
- Tchuem CRT, Auvigne V, Vaux S, Montagnat C, Paireau J, Besnard SM, et al. Vaccine effectiveness and duration of protection of COVID-19 mRNA vaccines against Delta and Omicron BA.1 symptomatic and severe COVID-19 outcomes in adults aged 50 years and over in France. Vaccine. 2023;41(13):2280-2288.
[Crossref] [Google Scholar] [PubMed]
- Fan J, Zhu L, Wu X, Luo C, Huang A, Wang W. COVID-19 vaccination in the mass vaccination center: Clinical practice and effectiveness analysis. Front Public Health. 2023;1072883.
[Crossref] [Google Scholar] [PubMed]
- Viana J, van Dorp CH, Nunes A, Gomes MC, van Boven M, Kretzschmar ME, et al. Controlling the pandemic during the SARS-CoV-2 vaccination rollout. Nat Commun. 2021;12:3674.
[Crossref] [Google Scholar] [PubMed]
- Kermack WO, McKendrick AG. A contribution to the mathematical theory of epidemics. Proc Roy Soc of London. 1927;A115(772):700-721.
- Kermack WO, McKendrick AG. Contributions to the mathematical theory of epidemics-II. The problem of endemicity. Proceedings of the Royal Society. 1932. Bull Math Bio. 1991;53(1-2):57-87.
[Crossref] [Google Scholar] [PubMed]
- Centers for Disease Control and Prevention (CDC). Symptoms of COVID-19. 2022.
- Seladi-Schulman J. What to know about asymptomatic COVID-19. Healtline. 2022.
- Sanghvi S. Timeline of COVID Symptoms. Lloyds Pharmacy Online Doctor. 2022.
- Weinberg AS. The complete COVID-19 timeline: Day-by-day symptoms. Carbon Health. 2022.
- Hollimon N. Symptoms of Coronavirus. WebMD. 2023.
- Mayo Clinic. Coronavirus disease 2019 (COVID-19). 2023.
- Heymann DL, Aylward R. Mass vaccination: When and why. Mass vaccination: Global aspects-progress and obstacles. Curr Top Microbiol Immunol. 2006;304:1-16.
[Crossref] [Google Scholar] [PubMed]
Citation: Ohmori H (2024) Effect of the Mass Vaccination Duration on the Spread of COVID-19-Evaluated by a Flexible Compartment Model. J Vaccines Vaccin. S25:002.
Copyright: © 2024 Ohmori H. This is an open-access article distributed under the terms of the Creative Commons Attribution License, which permits unrestricted use, distribution, and reproduction in any medium, provided the original author and source are credited.
