Indexed In
- Open J Gate
- Genamics JournalSeek
- JournalTOCs
- RefSeek
- Hamdard University
- EBSCO A-Z
- OCLC- WorldCat
- Publons
- Geneva Foundation for Medical Education and Research
- Google Scholar
Useful Links
Share This Page
Journal Flyer

Open Access Journals
- Agri and Aquaculture
- Biochemistry
- Bioinformatics & Systems Biology
- Business & Management
- Chemistry
- Clinical Sciences
- Engineering
- Food & Nutrition
- General Science
- Genetics & Molecular Biology
- Immunology & Microbiology
- Medical Sciences
- Neuroscience & Psychology
- Nursing & Health Care
- Pharmaceutical Sciences
Thesis - (2023) Volume 14, Issue 4
Effect of Symptomatic Rate on Spreading of COVID-19 Evaluated by a Flexible Compartment Model
Hiroo Ohmori*Received: 11-Jul-2023, Manuscript No. JCRB-23-22146 ; Editor assigned: 14-Jul-2023, Pre QC No. JCRB-23-22146 (PQ); Reviewed: 28-Jul-2023, QC No. JCRB-23-22146 ; Revised: 04-Aug-2023, Manuscript No. JCRB-23-22146 (R); Published: 14-Aug-2023, DOI: 10.35248/2155-9627.23.14.465
Abstract
For COVID-19, many of the infected individuals become symptomatic after the latent period is ended and should be isolated from the community. After the isolation period is ended, they become recovered individuals who have immunity and return to the community. Thus, they are capable of infecting susceptible individuals only during the latent period. Some infected individuals, however, are asymptomatic through the recovery period, which includes the latent period. They are infectious but not isolated, they stay in the community and continue infecting susceptible individuals through the recovery period, inducing an increase in the number of infected individuals, though they become recovered individuals who also have immunity in the community after the recovery period is ended. The number of symptomatic and isolated infected individuals of asymptomatic and staying infected individuals is controlled by the symptomatic rate. Thus, the symptomatic rate affects the number of infectious individuals continuing to infect susceptible individuals in the community. At the same time, the symptomatic rate affects the number of isolated individuals and, as a result the number of recovered individuals and the population excluding the individuals kept in isolation. Since the contact rate between infected individuals and susceptible individuals is affected by both the number of recovered individuals having returned to the community and the population excluding the individuals kept in isolation, the symptomatic rate also affects the contact rate. Namely, the symptomatic rate affects not only the number of infectious individuals but also the contact rate. This symptomatic rate could change commonly depending on the characteristics of the virus and/or on the health conditions of infected individuals. However, the symptomatic rate could be changed in the middle of the infection duration by political and medical interventions because the symptomatic rate practically means the isolation rate, and the isolation rate and/or the number of isolated individuals could be decided by some political and/or medical interventions induced by, for example, the capacity of hospital care. Therefore, the evaluation of the effect of the symptomatic rate could provide reference materials for political and/or medical measures. The effects of vaccination and isolation by PCR were also examined for cases with different symptomatic rates. The results of evaluation by a flexible compartment model, which is a model including the symptomatic rate as a term in the calculation equation and being able to evaluate the effect of isolated/recovered individuals on the spread of COVID-19, show that a small difference in the symptomatic rate causes a large difference in the number of infected individuals and in the infection duration. Vaccination and Polymerase Chain Reaction (PCR) tests were effective in reducing the number of infected individuals for cases with any symptomatic rates.
Keywords
Asymptomatic; Compartment model; COVID-19; Herd immunity; Infection during the latent period; Isolation; PCR test; SIR model; Symptomatic; Vaccination
Abbreviations
V: Vaccinated; RI/ RT/RAS: Recovered; P: Infected (Infectious, Patient); I/PI: Isolated; DAS/DTI/ DT: Death; N: Individuals; CR: Contact Rate; S(n): Susceptible Individuals; R(n): Recovered Individuals; AP: Newly Infected; TN: Total Individuals; PCR: Polymerase Chain Reaction; AS: Asymptomatic; SYR: Symptomatic Rate
Introduction
For COVID-19, infected individuals should be isolated from the community when they become symptomatic after the latent period is ended. Thus, the infected individuals do not infect susceptible individuals in the community after the latent period, though when the isolation period is ended, they become recovered individuals who have immunity and then return to the community. The infection has actually occurred during the latent period worldwide. However, when some infected individuals are asymptomatic, which means the symptomatic rate is not 1.0, but less than 1.0 they are not isolated. They stay in the community and continue infecting susceptible individuals until the recovery period is ended, and then they become recovered individuals who also have immunity in the community. For this case, the number of infected individuals may increases compared with that of the case with a symptomatic rate of 1.0, where all infected individuals become symptomatic and are isolated. Thus, the symptomatic rate directly affects the frequency of occurrence of infection.
On the other hand, in a community mixed with infected individuals, susceptible ones and recovered ones, the contact rate between the infected individuals and the susceptible ones is reduced by the contact of the infected individuals with the recovered ones, when the number of recovered individuals has been increased. At the same time, since the contact rate between the infected individuals and the susceptible ones is calculated using the ratios of the numbers of infected individuals, of susceptible ones and of recovered ones per the population excluding the individuals kept in isolation, the contact rate is affected not only by the number of recovered individuals but also by the population excluding the individuals kept in isolation and the dead. Since the number of isolated/recovered individuals is controlled by the symptomatic rate, the population excluding the individuals kept in isolation is also affected by the symptomatic rate. Therefore, the symptomatic rate affects the contact rate, indicating that the symptomatic rate indirectly affects the frequency of occurrence of infection.
As mentioned above, the symptomatic rate affects not only the number of infectious individuals who stay and continue infecting susceptible individuals in the community but also the contact rate between infected individuals and susceptible individuals. Namely, the symptomatic rate has direct and indirect effects on the spread of COVID-19.
In the calculation, the symptomatic rate practically indicates the ratio of the number of isolated individuals. Namely, the symptomatic rate can be recognized and used as the ‘isolation rate’. The symptomatic rate changes commonly depending on the characteristics of the virus and/or on the health conditions of infected individuals. However, the symptomatic rate could be changed/decided in the middle of the infection duration by political and/or medical interventions because the isolation rate and/or the number of isolated individuals could be changed/decided by some political and/or medical interventions, such as the capacity of hospital care. In some circumstances, political and/or medical interventions could be taken at any time during the infection duration. For such cases, the same things could occur as the symptomatic rate is set/ changed in the middle of the infection duration. Therefore, the evaluation of the effect of the symptomatic rate, which changes at some point during the infection duration, must provide reference materials for political and/or medical measures. Moreover, the effects of vaccination and isolation by PCR test, the former of which causes a decrease in the number of susceptible individuals and a reduction in the contact rate as the recovered individuals do, and the latter of which causes changes in the population and in the number of isolated/recovered individuals, are also examined for cases of different symptomatic rates.
The effect of the symptomatic rate on the spread of COVID-19 is evaluated by the flexible compartment mode specific to COVID-19 proposed by Ohmori [1], which contains the symptomatic rate as an independent valuable in the calculation equations and, as the dependent valuables, the number of isolated/recovered individuals and the population excluding the individuals kept in isolation, both of which change through the course of infection. Using this model, the number of isolated/recovered individuals induced by the symptomatic rate set at any time can be calculated, and the simulation for the number of infected individuals affected by the changes in the number of isolated/recovered individuals and in the population excluding the individuals kept in isolation can be performed. Then, the effect of the symptomatic rate can be evaluated by comparing the results of the simulation among the cases with different symptomatic rates.
Framework for flexible compartment model
The flexible compartment model proposed by Ohmori consists of six categories of Susceptible (Remainder): RM; Vaccinated: V; Recovered: RI, RT, RAS; Infected (Infectious, Patient): P; Isolated: I, PI; and Death: DAS, DTI, DT [1].
Susceptible: It is the number of susceptible individuals who are not infected but could become infected.
Vaccinated: It is the number of vaccinated individuals who are those who have immunity by vaccination and live and work in the real community.
Recovered: It is the number of recovered individuals who have been isolated from the real community to the isolation community when they have been symptomatic after the end of the latent period, have recovered from the disease and have immunity after the infectious period (the recovery period) is ended, and then have returned to the real community.
Infected: It is the number of infected individuals who have been infected and are capable of infecting susceptible individuals.
Isolated: It is the number of individuals kept in isolation, which means the number of infected individuals who have been isolated, kept in the isolation community until the recovery period is ended, and then become recovered individuals who have immunity.
Death: It is the number of individuals who have died of infection after the latent period, that is, the death toll (Figure 1).

Figure 1: Framework for the flexible compartment model.
A compartment on the left side, containing Susceptible, Vaccinated, Recovered, Infected and Death is a real community. Its population ‘N’ is changed by subtracting the number of isolated individuals (I, PI) and death (DAS) and by adding the number of recovered individuals (RI, RT). Another compartment on the right side, containing Isolated, Recovered and Death, these are the isolation community. Whose population that the number of individuals kept in isolation, is also changed by subtracting the number of recovered individuals (RI, RT) returning to the real community and of the death (DTI, DT). The large compartment consisting of the two compartments mentioned above is the whole community of which the population is expressed by TN(n). TN(n) includes the number of individuals living in the two compartments and the toll of death (DAS, DTI, DT) occurring at the fatality rate in the two compartments. TN(n) and N(n) are changed due to the number of Susceptible (NAP(n)) and/or Infected (UP(n)) coming in and/or going out of the community. As shown above, each compartment contains individuals belonging to different categories and its population changes by interacting with another compartment and with the outside.
The infected individuals in the community P(n), are separated into three groups of those (I(n)) who are confirmed to be infected due to being test positive, those (PI(n)) who become symptomatic after the latent period and those (AS(n)) who are asymptomatic through the recovery period. The isolated individuals are composed of two groups of those (I(n)) who are confirmed to be infected due to being test positive and then isolated and those (PI(n)) who are symptomatic in the community and then isolated. Each of them needs to be calculated in a different manner according to the coefficients of the test positive rate and the symptomatic rate.
The recovered individuals are composed of two groups; One is the group of recovered individuals in the right compartment, consisting of those (RI(n')) who were isolated due to being test positive I(n), and have been recovered and those (RT(n')) who were isolated due to being symptomatic in the community PI(n), and have been recovered. For the date (n') of returning to the community, each of them must be calculated in a different manner according to the isolation durations that are different from each other. The total number of recovered individuals (RI(n')+RT (n')) is not always equal to that of infected individuals (I(n)+PI(n)) because RI(n')+RT(n') is the number subtracting the total number of deaths (DTI(n)+DT(n)) from (I(n)+PI(n). The other is the group of recovered individuals in the left compartment RAS(n'), who are the individuals who recovered from the asymptomatic in the community. The number of recovered individuals (RAS(n')) is not always equal to that of asymptomatic infected individuals (AS(n)) because RAS(n') is the number subtracting the number of deaths (DAS(n) from AS(n)).
The death individuals are also composed of two groups of those (DAS(n)) who are asymptomatic and die of infection after the latent period in the community and those (DTI(n) and DT(n)) who die during the isolation period. Each of them needs to be calculated in a different manner according to different fatality rates. The vaccinated individuals V(n), have immunity and live and work in the community. Vaccination decreases the number of susceptible individuals and reduces the contact rate between infected individuals and susceptible individuals.
Calculation process of the flexible compartment model
Contact rate in the community mixed with infected, susceptible and recovered individuals: The contacts between infected individuals and susceptible individuals that cause infections actually occur in the real community mixed with infected, susceptible and recovered individuals. Thus, infected individuals contact not only susceptible individuals but also recovered individuals. From a physical point of view, the contact of the infected individuals with the recovered ones must reduce the contact rate between the infected individuals and the susceptible ones when the number of recovered individuals has increased. Accounting for the reduction effect of the recovered individuals on the contact rate, the contact rate should be given by the following equation:
cr (n) = (S (n) / N (n))(1−δ (R(n)))...............(1)
Where the cr(n) is the contact rate, n is the date starting from 1 when the infection begins, S(n) is the number of susceptible individuals in the community, R(n) is the number of recovered individuals who have returned to the community and N(n) is the population including the recovered individuals having returned to the community but excluding the individuals kept in isolation and the dead. The term –δ(R(n)/N(n)) is the reduction effect of the recovered individuals on the contact rate between the infected individuals and the susceptible ones, and the term (1–δ(R(n)/N(n)) is the reduction rate of the contact rate. The reduction effect increases with a decreasing value of (1–δ(R(n)/N(n)), meaning that the contact rate decreases with an increase in the number of recovered individuals. ‘δ’ is a coefficient expressing the activity level of the recovered individuals in the community. When the value of δ is given by 1, the activity is the same level as the susceptible individuals, and when the value of δ is given by 0, the recovered individuals are not active, meaning a similar condition as they are kept in isolation, though the number of recovered individuals is added to the population. This contact rate cr(n), is used for the calculation of the number of infected individuals as shown in Equation (2).
The reduction effect is caused not only by the recovered individuals but also by the vaccinated individuals who have been vaccinated, have immunity and are living and working in the community. The reduction effect of vaccination should be taken into account for the simulation. The model contains the reduction effect of both the recovered individuals and the vaccinated individuals.
Calculation of the number of infected individuals, the number of individuals newly infected a day and the increment/decrement in the number of infected individuals: It should be confirmed that the number of infected individuals P(n), is not equal to the number of individuals infected each day AP(n). The former is the total number of individuals being infected and infectious in the community that is, the sum of the number of infected individuals during the latent period and/or the recovered period in the community, whereas the latter is the number of individuals newly infected for one day. However, P(1) the initial number of infected individuals in the community, is arbitrarily set for simulation. The increment and/or decrement in the number of infected individuals on date n in the community ΔP(n), can be calculated by subtracting the number of individuals isolated on date n from the number of individuals newly infected on date n.
For simulation using an Excel file, calculation is performed based on Equation (2). The Excel file and the meaning of individual terms/variables are explained in the supplementary files. The independent variables of twenty terms can be set arbitrarily by them, and the values of the dependent variables of fifty-five terms are uniquely determined based on the independent values given by, The number of individuals newly infected on date n and AP(n) is given by the following equation:
AP(n(night))=(pfc(n)/lp(n)) × (RM(n)/N(n)) × icf(n) ×(1–(alI(n) × (CRI(n)+CRT(n))+al(n) × CRAS(n)+alV(n) × V(n))/ N(n)) × (RP(n)/N(n)) × RM(n) ………..(2)
Where the coefficient pfc(n) is the potential (biological) infectious capacity of coronavirus, which is an approximate value indicating the number of susceptible individuals infected during the latent period lp(n). The latent period lp(n), is the time interval between when an individual is infected and when people is symptomatic. pfc(n)/lp(n) is the number of susceptible individuals infected by an infected individual a day, and its value, including decimal places, is used in the calculation. The coefficient icf(n) is the infection reduction rate by infectious control measures preventing the spread of virus, such as facemasks, partitions and disinfectants. The coefficient alI(n) is the activity level of the recovered individuals having returned to the community from the isolation, al(n) is the activity level of the individuals recovered from the asymptomatic in the community and alV (n) is the activity level of the vaccinated individuals.
In a strict sense as explained in symptomatic rate, since the infection occurs during the daytime from the morning to the evening for the purpose of calculation AP(n(night)), which is the value of AP(n) at night is the correct number of individuals newly infected a day, which has increased/decreased from the AP(n) in the morning, which is equal to the AP(n) of the previous night, i.e. AP(n–1(night)).
RM(n) is the number of susceptible individuals in the community, N(n) is the population excluding the individuals kept in isolation and dead, RP(n) is the number of infected individuals excluding the individuals kept in isolation and the dead, CRI(n) is ΣRI(n) and RI(n) is the number of recovered individuals who were isolated due to being test positive and have returned to the community, CRT(n)=ΣRT(n) and RT(n) is the number of recovered individuals who have been isolated due to being symptomatic in the community and have returned to the community, CRAS(n) is ΣRAS and RAS(n) is the number of recovered individuals who were infected but did not become symptomatic, were asymptomatic were not isolated they were staying in the community had continued infecting until the recovery period was ended and then have become the recovered individuals and V(n) is the number of vaccinated individuals who have immunity as the recovered individuals do.
RM(n) is the number of susceptible individuals in the community as mentioned above. It indicates the number of susceptible individuals subtracting the number of individuals confirmed to be infected due to being test positive and isolated (CI), the cumulative number of individuals having been infected (CAP), which includes the number of individuals having recovered and the number of vaccinated individuals (V) from the total population of the community (TN), and therefore is given by:
RM(n)=TN(n)–(CI(n)+CAP(n)+V(n) ………………….(3)
Where, TN(n) is the total population of the whole community, such as a city. TN(1) is the initial population of the community arbitrarily given by individuals and TN(n) is changed by coming in/ going out of the susceptible (NAP(n)) and/or the infected (UP(n)).
CI(n)=ΣI(n) and I(n) is the number of individuals isolated due to being test positive. Since all the individuals confirmed to be infected due to test positivity are not always isolated and the individuals decided to be isolated are isolated on the day next to the date when they are confirmed to be infected in the actual calculation, I(n) is given by:
I(n)=CP(n–1) × i(n–1) …………….(4)
Where, the coefficient i(n) is the isolation rate for the individuals who are confirmed to be infected due to being test positive. CP(n) is the number of individuals confirmed to be infected due to being test positive. The individuals decided to be isolated are isolated on the next day for the purpose of calculation. Conversely, the individuals confirmed to be infected on the previous day, date (n– 1) are isolated on date n.
Thus, I(n) is given by I(n)=i(n–1) × CP(n–1)
CP(n) is given by:
CP(n)=T(n) × bp(n) × ir(n) ………………(5)
Where, T(n) is the number of individuals having PCR test and/or the antibody test, which people can set arbitrarily on any days when tests are performed and the coefficient bp(n) is the magnification of incidence rate for the test to the incidence rate ir(n) in the community.
The incident rate ir(n), is given by:
ir(n)=P(n)/TN(n) …………….(6)
Where, P(n) is the number of infected individuals already having existed in the community, though P(1) which is the initial number of infected individuals in the community and is arbitrarily given by individual. TN(n) is the total population of the whole community. Since individuals who have the test are mainly close contacts, the incidence rate for the test would be biased to be higher than ir(n). The incidence rate for the test is given by the magnification with respect to ir(n). As a result, the value of bp(n) × ir(n) indicates the positive rate for the PCR test, tir(n). The positive rate tir(n), is given by:
tir(n)=bp(n) × ir(n) …………..(7)
CAP(n) means ΣAP(n) and indicates the cumulative number of individuals newly infected a day up to the morning of date n, which is equal to the cumulative number of infected individuals up to the night of date (n–1).
V(n) is the number of vaccinated individuals who are vaccinated and have immunity and is given by:
V(n)=TN(1) × (v(n)–b(n)) ……………..(8)
Where, TN(1) is the initial total population of the community, the coefficient v(n) is the vaccination rate and b(n) is the breakthrough rate. The term (v(n)–b(n)) indicates an immunity acquisition rate for the purpose of calculation. However, for the individuals who were vaccinated and had once immunity, some of them would suffer breakthrough infection considerably later after the date when they were vaccinated. For example, when vaccination is carried on date n, breakthrough infection could occur on date (n+m), where m would indicate dozens of days. Therefore, b(n) should be applied to the individuals who were vaccinated on date (n–m) and were infected by breakthrough infection on date n. The value of m is arbitrarily supposed/decided by people for simulation. The value of b(n) should be set to 0 on the day when breakthrough infection does not occur. The vaccinated individuals who have become infected are reset to be susceptible individuals on the date when breakthrough infection occurs.
N(n) is the population excluding the individuals kept in isolation and dead, that is the total number of individuals living and working in the community, which is explained in methods-Population excluding the individuals kept in isolation.
RP(n) is the number of infected individuals excluding the individuals kept in isolation and the dead, that is the number of infected individuals living and working in the community. For example, the infected individuals during the latent period and/ or asymptomatic infected individuals even after the latent period. Thus RP(n) could be called the Spreader who continues to infect susceptible individuals in the community. When n is 1, meaning the first day of simulation, RP(1) is equal to P(1) which is the initial number of infected individuals in the community and is arbitrarily given by individuals. Since RP(n) is the number of infected individuals minus the number of isolated individuals (PI(n)) of the dead (DAS(n)) and of the recovered individuals living in the community (RAS(n)) from the total number of infected individuals up to date n, it is given by the following equation:
RP(n) = Σ( AP(n) − PI (n −1) − RAS (n))........(9)
Where, PI (n) is the number of symptomatic individuals who become symptomatic on the day after the end of the latent period in the real community and are isolated on the next day, PI(n) is given by:
PI(n)=AP(n–(lp+1)) × syr(n–(lp+1)) …………(10)
Where, lp(n) is the latent period and (n–(lp+1)) indicates the latent period+1 before date n, meaning the day after the end of the latent period, because the infected individuals become symptomatic and are isolated on the day after the end of the latent period, as explained in ‘symptomatic rate’. The value of AP(n–(lp+1)) is the number of infected individuals who were newly infected on date (n–(lp+1)), which is the day after the end of the latent period. The coefficient syr(n) is the symptomatic rate on date n. When syr(n) is 1, all the infected individuals become symptomatic and isolated.
Conversely, the number of asymptomatic infected individuals AS(n) is given by:
AS(n)=AP(n–(lp+1))–PI(n) ………….(11)
DAS(n) is the number of individuals who are asymptomatic and die of infection after the latent period in the community that is, the death toll in the community. It is given by:
DAS(n)=AS(n–trunc((rp–lp)/2)) × fr(n–trunc((rp–lp)/2)) ……(12)
Where, the coefficient rp(n) is the recovery period, which is the time interval between when an individual is infected and when people recovers from the disease and is not capable of infecting. Then (rp–lp) is equivalent to the isolation period, AS(n–trunc((rp– lp)/2)) is the number of asymptomatic infected individuals who were not isolated and were staying in the community on the day trunc((rp–lp)/2) days before date n. AS(n) is the number of infected individuals subtracting PI from AP, as shown in Equation (11), the coefficient fr(n) is the fatality rate for the asymptomatic infected individuals in the community. Death of infected individuals occurs on the middle date in the isolation period, i.e. trunc((rp–lp)/2). Namely, some of the infected individuals who have been isolated on date n pass away on date (n+trunc((rp–lp)/2)). For asymptomatic individuals also same condition is applied. When the number of asymptomatic individuals infected on date n is AS(n), the AS(n) × fr(n) individuals also die on date (n+trunc((rp–lp)/2)). Conversely, the death toll of the asymptomatic individuals on date n, DAS(n) is given in Equation (12).
RAS(n) is the number of recovered individuals who were infected but were asymptomatic and were not isolated, having continued infecting in the community until the recovery period was ended and then becoming recovered individuals. In the actual calculation, RAS(n) is the number of asymptomatic infected individuals excluding the death toll, and then it is given by:
RAS(n)=AS(n–(rp–lp))–DAS(n–(1+trunc((rp–lp)/2)))=AS(n–(rp– lp))–AS(n–(rp-lp)) × fr(n–(rp–lp))……(13)
CRI(n) is ΣRI(n) and RI(n) is the number of recovered individuals who were isolated due to being test positive. RI(n) is given by:
RI(n)=I(n–rpI)–DTI(n–(1+trunc(rpI/2))) ………….(14)
Where, I(n) is the number of individuals isolated due to being test positive and given by Equation (4). DTI(n) is the death toll of the individuals isolated due to being test positive and is given by:
DTI(n)=I(n–trunc(rpI/2)) × frI(n–trunc(rpI/2)) ………..(15)
Where, frI(n) is the fatality rate for the isolated individuals and rpI(n) is the isolation period for the isolated individual due to being test positive, which is less than or equal to rp. The death of isolated individuals occurs on the middle date in the isolation period. When the number of individuals isolated on date n is I(n), then I(n) × frI(n) individuals die on day (n+rpI/2)days, after date n. Conversely, for the death toll on date n, the date of death of I is (n–trunc(rpI/2)).
CRT(n)=ΣRT(n) and RT(n) is the number of recovered individuals who have been isolated due to being symptomatic in the community, RT(n) is given by:
RT(n)=PI(n–(rp–lp))–DT(n–(1+trunc((rp–lp)/2))) …………..(16)
Where, DT(n) is the death toll of the individuals isolated due to being symptomatic.
DT(n)=PI(n–trunc((rp–lp)/2)) × frI(n–trunc((rp–lp)/2)) …….(17)
Where PI (n) is the number of symptomatic infected individuals given by Equation (10) and frI(n) is the fatality rate for the isolated individuals. Then (rp–lp) is the isolation period for the individuals isolated due to being symptomatic.
Here Equation (2) is transformed to the following equation:
AP(n(night))=p(n) × RM(n) …………..(18)
Where, p(n) is the infection coefficient, which is the infectious capacity including the contact rate changing with the numbers of susceptible individuals, infected individuals, recovered individuals and vaccinated individuals in the (real) community:
p(n)=(pfc(n)/lp(n)) × (RM(n)/N(n)) × icf(n) × (1–(AL(n)/N(n))) × (RP(n)/N(n)) ………….(19)
Where, AL(n) is the sum of the activity levels of the recovered individuals and vaccinated individuals:
AL(n)=alI(n) × (CRI(n)+CRT(n))+al(n) × CRAS(n)+alV(n) × V(n) …………..(20)
The term AL(n)/N(n) is equivalent to the term δ(R(n)/N(n)) and the term (1–(AL(n)/N(n))) is equivalent to the term (1–δ(R(n)/N(n)) of Equation (1). When the value of AL(n) is given by 1, the activity of the recovered individuals is the same level as the susceptible individuals and when the value of AL(n) is given by 0, the recovered individuals are not active, meaning a similar condition as they are kept in isolation. Though the number of recovered individuals who have returned to the community is added to the population.
The value pfc(n)/lp(n) is the infection rate (persons/person/day) for an infected individual and (RP(n)/N(n) indicates the ratio of the number of infected individuals living in the community. Thus, the value of (pfc(n)/lp(n)) × (RP(n)/N(n)) indicates the probability of occurrence of infection by the total number of infected individuals in the community. The value of (RM(n)/N(n)) × (1–(AL(n)/N(n))) indicates the probability of occurrence of contact for a susceptible individual. Therefore, the coefficient p(n) indicates the possibility of infection per susceptible individual per day in the community with mixed infected, susceptible and recovered individuals.
The infected individuals, P(n) are given by the following equation:
P(n)=RP(n)+AP(n(night))=RP(n)+p(n) × RM(n) ………….(21)
Taking the number of isolated individuals into consideration, then the rate of change in the number of infected individuals, ΔP(n) is the increment and/or decrement in the number of infected individuals a day in the community, can be calculated by subtracting the number of individuals isolated on date n due to being symptomatic from the number of individuals newly infected on date n and is given by the following difference equation:
ΔP(n)=AP(n)–PI(n)=AP(n)–syr(n') × AP(n') …………….(22)
Where, n means the date the latent period before date n and indicates that PI(n) is the number of infected individuals who have been newly infected on date n and have been symptomatic on the day after the end of the latent period and then have been isolated on date n, as explained in symptomatic rate.
For the simulation using Equation (2) and Equation (18), where n is 1, the first day of simulation N(1) is equal to TN(1), which is the initial total population of the community. TN(1) is arbitrarily set by individual. RP(1) is equal to P(1), which is the initial number of infected individuals. P(1) is also arbitrarily set by individual. RM(1) is the initial number of susceptible individuals in the community and is inevitably decided by subtracting P(1) from N(1).
Methodology
Symptomatic rate
From a statistical point of view all infected individuals do not become symptomatic before the end of the latent period. After the end of the latent period, the infected individuals are separated into two categories: the ‘symptomatic’ individuals and the ‘asymptomatic’ individuals. The symptomatic individuals develop symptoms such as fever or chills, cough, fatigue, muscle or body aches, loss of taste or smell, nausea or vomiting, diarrhea and others on the day after the end of the latent period and the asymptomatic individuals do not develop any symptoms even after the end of the latent period, that is throughout the infectious period (the recovery period) which includes the latent period. All individuals of both categories become the recovered individuals after the end of the recovery period [2,3].
The symptomatic rate (syr), is the ratio of the number of individuals who become symptomatic per all the number of individuals newly infected a day. However, the following symptoms occur on the day after the latent period. The individuals who were infected on date n become symptomatic on date (n+lp) and syr(n) indicates the ratio of the number of individuals who were infected on date n and become symptomatic on date (n+lp) to the total number of individuals newly infected on date n. Thus the purpose of calculation date n of syr (n) indicates date n when the symptomatic individuals are infected, though they become symptomatic on date (n+lp). The latent period includes the day when they are infected. They are isolated due to being symptomatic on the next day, on date (n+(lp+1)).Then the infected individuals who were infected on date n become symptomatic on date (n+lp) and are isolated on the next day, (n+(lp+1)), that is, the day after the end of the latent period. Therefore, the symptomatic rate expressed as syr (n) means the symptomatic rate for the individuals infected on date n and the individuals infected on date n are isolated on date (n+(lp+1)).
As all infected individuals are not always symptomatic and also all infected individuals are not always isolated. The number of isolated individuals PI(n), which indicates the number of symptomatic infected individuals isolated a day on date n, is given by the following equation:
PI(n)=AP(n–(lp+1)) × syr(n–(lp+1)) …………..(23)
Where, date n indicates the day after the end of the latent period and date (n–(lp+1)) indicates the date when the individuals who are isolated on date n were infected. Thus, the value of AP(n–(lp+1)) is the number of infected individuals who were newly infected on date (n–(lp+1)), and some of them should be isolated on date n. Date (n–(lp+1)) is equivalent to n, in Equation (22).
For example, when the latent period lp is 5, n is 157 and lp+1=6, then (n–(lp+1))=(157–6)=151. Thus, the number of individuals isolated on the 157th is AP(151) × syr(151). When the value of the symptomatic rate is set to 0.8 on the 151st, 80% of the individuals infected on the 151st become symptomatic on the 156th, which is the day after the end of the latent period and are isolated on the 157th. However, 20% of the individuals infected on the 151st do not become symptomatic on the 156th, being asymptomatic and then not isolated, staying in the community (Figures 2 and 3).
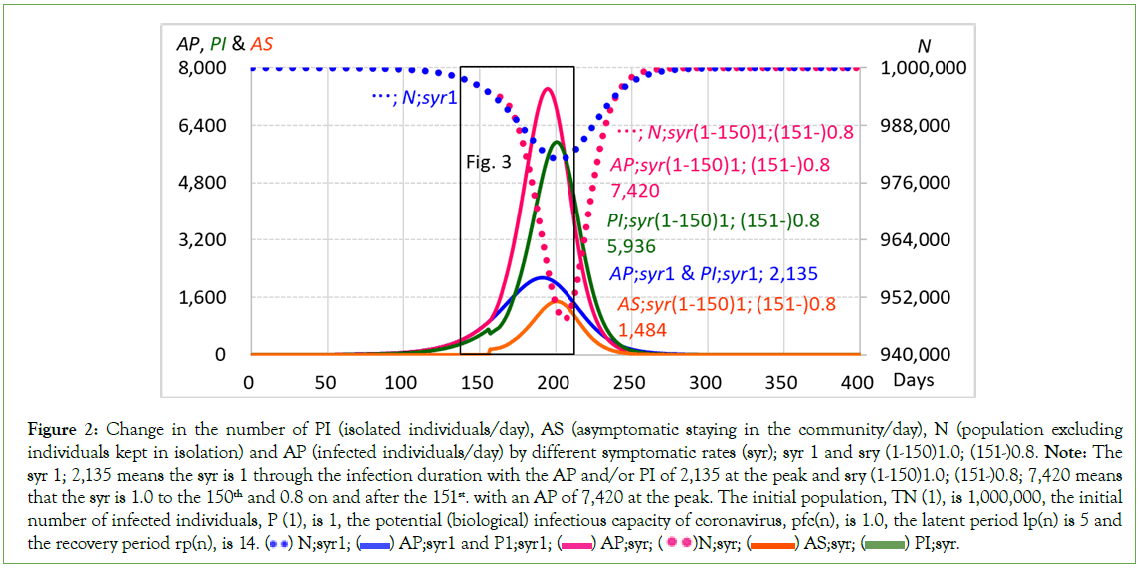
Figure 2: Change in the number of PI (isolated individuals/day), AS (asymptomatic staying in the community/day), N (population excluding
individuals kept in isolation) and AP (infected individuals/day) by different symptomatic rates (syr); syr 1 and sry (1-150)1.0; (151-)0.8. Note: The
syr 1; 2,135 means the syr is 1 through the infection duration with the AP and/or PI of 2,135 at the peak and sry (1-150)1.0; (151-)0.8; 7,420 means
that the syr is 1.0 to the 150th and 0.8 on and after the 151st. with an AP of 7,420 at the peak. The initial population, TN (1), is 1,000,000, the initial
number of infected individuals, P (1), is 1, the potential (biological) infectious capacity of coronavirus, pfc(n), is 1.0, the latent period lp(n) is 5 and
the recovery period rp(n), is 14. ( ) N;syr1; (
 ) AP;syr1 and P1;syr1; (
 ) AP;syr; (
 )N;syr; (
 ) AS;syr; (
 ) PI;syr.
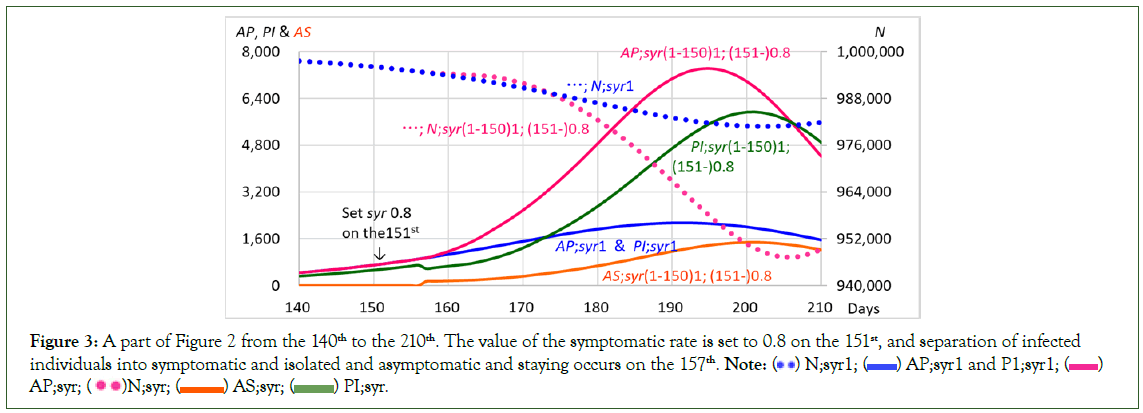
Figure 3: A part of Figure 2 from the 140th to the 210th. The value of the symptomatic rate is set to 0.8 on the 151st, and separation of infected
individuals into symptomatic and isolated and asymptomatic and staying occurs on the 157th. Note: ( ) N;syr1; (
 ) AP;syr1 and P1;syr1; (
 )
AP;syr; (
 )N;syr; (
 ) AS;syr; (
 ) PI;syr.
The number of asymptomatically infected individuals, AS(n), is given in Equation (11):
AS(n)=AP(n–(lp+1))–PI(n) …………….(24)
Asymptomatic individuals continue to infect susceptible individuals until the recovery period ends and then become recovered individuals in the community.
AP(n) in the morning on date n is given by:
AP(n)=RPM(n)–RP(n–1) …………..(25)
Where, RP(n–1) is the number of infected individuals existing on the previous day, excluding the individuals kept in isolation and the dead and RP(n) is given in Equation (9), RPM(n) is the remaining number of infected individuals in the community excluding the number of individuals isolated due to being test positive but including the number of individuals who are test positive but are not isolated:
RPM(n)=P(n)+UP(n)–I(n–1) ………….(26)
Where, P(n) is the number of infected individuals in the morning on date n, meaning the number of infected individuals before any isolated individuals and the dead have been taken away, UP(n) is the number of infected individuals coming in/going out of the community and I(n) is the number of individuals isolated due to being test positive. The value of AP(n) includes the symptomatic infected individuals, the asymptomatic infected individuals and the individuals who test positive but are not isolated, staying in the community.
The value of AP(n) in the morning on date n is equal to that of the previous night, that is AP(n–1(night)). After isolating the individuals who became symptomatic on the previous day (on date (n-1)) and removing the dead who died on the previous day, the calculation of the number of infected individuals is performed. For the purpose of calculation, the infection occurs during the daytime from the morning to the evening and thus the number of individuals newly infected on that day (on date n) is given as AP(n(night)) by Equation (2), and the number of infected individuals existing at night on that day is given by P(n(night)) by Equation (21).
Population excluding the individuals kept in isolation
The population excluding the individuals kept in isolation and dead in the real community, N(n) is changed through the infection duration is given by the following equation;
N(n)=TN(n–)–(CI(n-1)+CPI(n–1)+CDAS(n–1)+CDT(n- 1))+CRI(n–1)+CRT(n–1) …………….(27)
Where, TN(n) is the total population of the community. When n is 1, meaning the first day of simulation N(1) is TN(1) and TN(1) is the initial population of the community, which is arbitrarily set by individual and other terms of Equation (27) are all 0. Using (n–1) means that the population on the previous night becomes the population in the morning of date n. T(n) is changed by the number of susceptible individuals (NAP(n)) and infected individuals (UP(n)) who come in and/or leave the community (Figures 2, 3).
CI(n) is ΣI(n), here I(n) is the number of individuals isolated due to being positive for the PCR test and given in Equation (4).
CPI(n) is ΣPI(n), here PI(n) is the number of individuals isolated due to being symptomatic and as previously explained, it is given by Equation (10) and Equation (23).
CDAS(n) is ΣDAS(n) and DAS(n) is given by Equation (12).
CDT(n) is ΣDT(n) and DT(n) is the death toll of the individuals isolated due to being symptomatic. DT(n) is given by:
DT(n)=PI(n–trunc((rp-lp)/2)) × frI(n–trunc((rp–lp)/2)) …………(28)
Where, PI (n) is given by Equation (10) and Equation (23) and frI(n) is the fatality rate for the isolated individuals.
CRI(n)=ΣRI(n) and RI(n) is the number of recovered individuals who were isolated due to being test positive, RI(n) is given by:
RI(n)=I(n–rpI)–DTI(n–(1+trunc(rpI/2)))=I(n–rpI)–I(n-rpI) × frI(n– rpI) …………..(29)
Where DTI(n) is the death toll of the individuals isolated due to being test positive, DTI(n) is given by:
DTI(n)=I(n–trunc(rpI/2)) × frI(n–trunc(rpI/2)) …………(30)
CRT(n)=ΣRT(n) and RT(n) is the number of recovered individuals who have been isolated due to being symptomatic, RT(n) is given by:
RT(n)=PI(n–(rp–lp))–DT(n–(1+trunc((rp–lp)/2))) ………………..(31)
N(n) is changed by the occurrence of isolation and death. When the syr is set to 1.0 through the infection duration syr1, meaning that all the infected individuals become symptomatic and are isolated, N(n) decreases down to 981,124 on the 206th and then recovers to 1,000,000 on the 366th. On the other hand, when syr(151) is set to 0.8 on the 151st, syr (1-150)1.0; ((151-)0.8), meaning that 80% of the individuals newly infected a day become symptomatic and are isolated and 20% of the individuals newly infected a day are asymptomatic and stay in the community on and after the 151st, N(n) decreases down to 947,350 on the 206th and then recovers to 1,000,000 on the 323rd (Figures 2, 3).
For the difference between them, the change in the difference ΔN=N(syr(1–150)1.0; (151–)0.8)–N(syr1.0) is shown in Figure 4. N(n) of syr((151-)0.8) is larger than that of syr1.0 for the early duration from the 158th to 173rd, with a maximum difference of 1,504 on the 166th. During from the 174th to the 240th, N(n) becomes considerably less with the maximum difference of –33,774 on the 206th, because the increment of the number of isolated individuals newly infected a day overcomes that of the number of the newly infected individuals staying in the community. From the 241st to the 335th, N(n) is larger again with a maximum difference of 1,028 on 252nd. After 336th there is no difference between them.
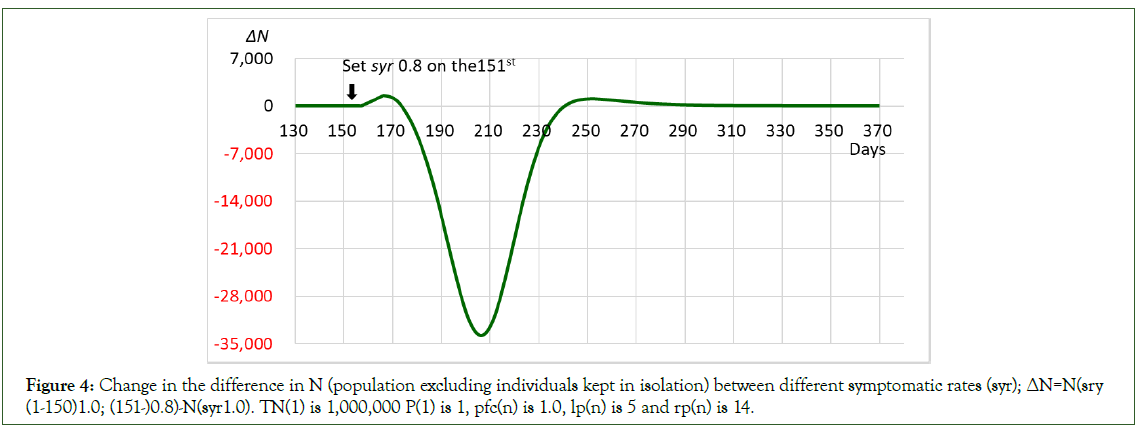
Figure 4: Change in the difference in N (population excluding individuals kept in isolation) between different symptomatic rates (syr); ΔN=N(sry (1-150)1.0; (151-)0.8)-N(syr1.0). TN(1) is 1,000,000 P(1) is 1, pfc(n) is 1.0, lp(n) is 5 and rp(n) is 14.
Since, as shown by Equation (1) and Equation (2) where, N(n) is included as a denominator of the fraction, the contact rate between infected individuals and susceptible individuals is controlled by the population as well as the number of infected individuals and susceptible individuals, and the change in the number of infected individuals should be affected by the change in the population. It would be examined in changes in the number of the population excluding the number of individuals kept in isolation and its relation to the change in the number of individuals newly infected a day by different symptomatic rate.
Results and Discussion
Change in the number of infected individuals affected by the occurrence of asymptomatic staying infected individuals
The number of infected individuals is calculated by;
AP(n(night))=(pfc(n)/lp(n)) × (RM(n)/N(n)) × icf(n) × (1–(alI(n) × (CRI(n)+CRT(n))+al(n) × CRAS(n)+alV(n) × V(n))/ N(n)) × (RP(n)/N(n)) × RM(n) …………(32)
The number of isolated individuals PI(n), which indicates the number of symptomatic infected individuals isolated a day on date ‘n’ is given by the following equation, which was previously shown in Equation (10) and Equation (23).
PI(n)=AP(n–(lp+1)) × syr(n–(lp+1)) ……………(33)
When the symptomatic rate (syr) is set to 1.0 on and after the first day of simulation, since all the infected individuals become symptomatic and are isolated, the number of individuals isolated on date (n+(lp+1)) is equal to that of individuals infected on date n, as explained in symptomatic rate. Where, P is the number of infected individuals, which is the sum of the infected individuals existing in the community during the latent period and I2 is the number of individuals kept in isolation, which is the sum of the isolated individuals existing during the isolation period, which is the period from the date when they are isolated to the date when they recover from the disease and return to the community. Since the isolation period is relatively longer than the latent period, the number of individuals kept in isolation I2 is larger than that of infected individuals ‘P’ (Figure 5).
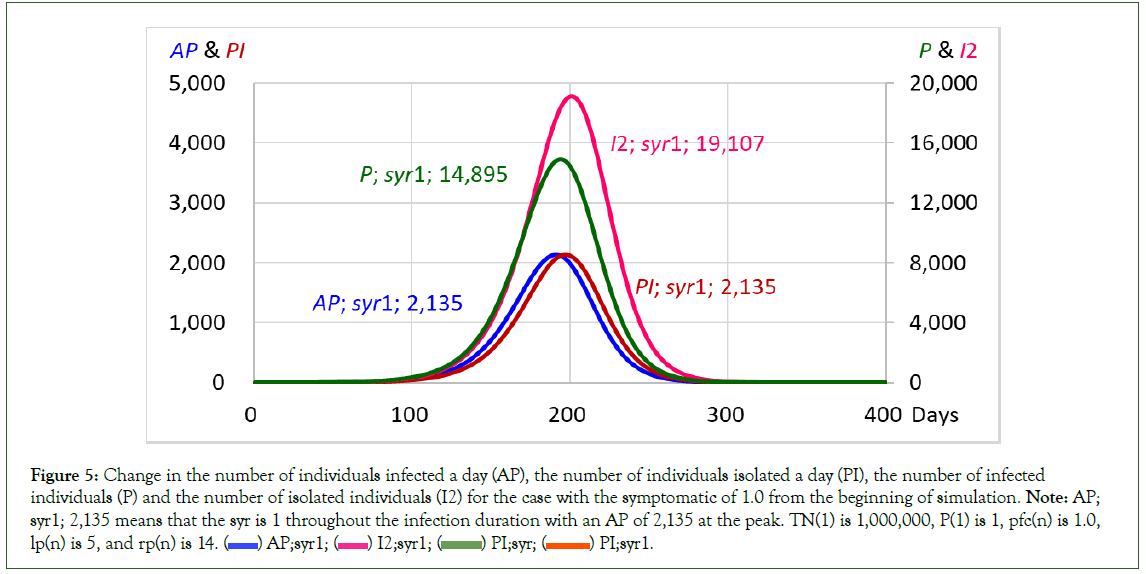
Figure 5: Change in the number of individuals infected a day (AP), the number of individuals isolated a day (PI), the number of infected
individuals (P) and the number of isolated individuals (I2) for the case with the symptomatic of 1.0 from the beginning of simulation. Note: AP;
syr1; 2,135 means that the syr is 1 throughout the infection duration with an AP of 2,135 at the peak. TN(1) is 1,000,000, P(1) is 1, pfc(n) is 1.0,
lp(n) is 5, and rp(n) is 14. ( ) AP;syr1; (
 ) I2;syr1; (
 ) PI;syr; (
 ) PI;syr1.
Here, the number of individuals newly infected a day AP, reaches 2,135 at the peak on the 191st and 192nd and then decreases to 0 on the 326th. The number of infected individuals P, reaches 14,895 at the peak on the 194th and then decreases to 0 on the 354th, with a total number of infected individuals of 141,788 (Table 1).
| AP: Infected/day | P: Infected | I2: Isolated | Total | ||||||||||
|---|---|---|---|---|---|---|---|---|---|---|---|---|---|
| Peak | Duration | Peak | Duration | Peak | Duration | RM | SRT: Recovered | CAP | |||||
| syr | Date | Number | Date-Date | Date | Number | Date-Date | Date | Number | Date-Date | Susceptible | Isolated | Community | Infected Total |
| 1.0 | 191·192 | 2135 | 1-326 | 194 | 14895 | 1-354 | 201 | 19107 | 7-365 | 858212 | 141788 | 0 | 141788 |
| 0.8 | 125 | 8670 | 1-217 | 129 | 73678 | 1-240 | 135 | 61387 | 7-243 | 663904 | 268877 | 67219 | 336096 |
Table 1: Comparison of the number of Infected/day, Infected, Isolated, Susceptible and Recovered cases with symptomatic rates, syr, of 1 and 0.8. SRT is the total number of recovered individuals. The initial population, TN(1), is 1,000,000, the initial number of infected individuals P(1) is 1, the potentia`l (biological) infectious capacity of coronavirus pfc(n) is 1.0, the latent period lp(n) is 5 and the recovery period rp(n) is 14.
When the symptomatic rate is 0.8, 80% of individuals newly infected on a day become symptomatic and are isolated and the remaining 20% are asymptomatic and continue staying in the community. Changes in the number of individuals newly infected a day AP, the number of individuals who become symptomatic and isolated a day PI, the number of individuals who are asymptomatic and staying in the community AS, the number of infected individuals in the community P and the number of individuals kept in isolation I2 (Figure 6).
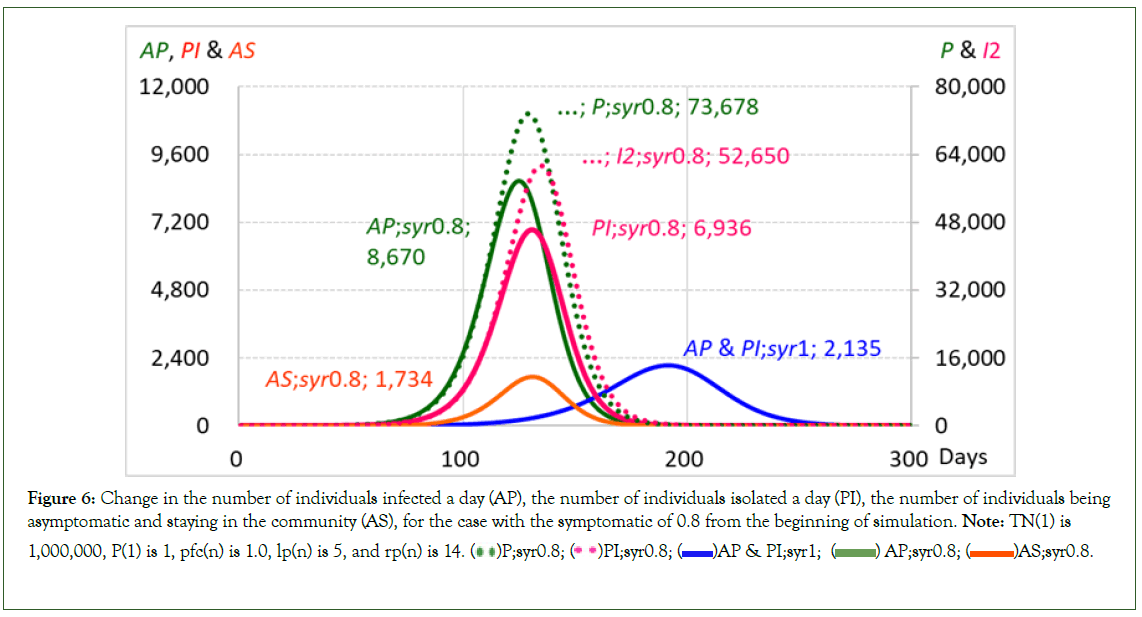
Figure 6: Change in the number of individuals infected a day (AP), the number of individuals isolated a day (PI), the number of individuals being
asymptomatic and staying in the community (AS), for the case with the symptomatic of 0.8 from the beginning of simulation. Note: TN(1) is
1,000,000, P(1) is 1, pfc(n) is 1.0, lp(n) is 5, and rp(n) is 14. ( )P;syr0.8; (
 )PI;syr0.8; (
 )AP & PI;syr1; (
 ) AP;syr0.8; (
  )AS;syr0.8.
Since the asymptomatic infected individuals staying in the community continue infecting the susceptible individuals in the community until the recovery period is ended, the number of individuals newly infected a day AP, reaches 8,670 at the peak on the 125th and then decreases to 0 on the 217th. It is approximately 4 times larger than that of the case with a syr of 1.0. Out of 8,670 infected individuals, 1,374 individuals were asymptomatic and staying in the community (AS) and 6,936 individuals were isolated due to being symptomatic (PI). Then the number of isolated individuals PI, which indicates the number of individuals who need to get treatment, also rapidly increases up to 6,936 on the 131st, though it is 2,135 on the 197th for the case with a syr of 1.0 (Table 1).
Since the sum of the asymptomatic infected individuals who are staying in the community during the recovered period becomes markedly large, even though the asymptomatic rate is not so large, the number of infected individuals P, is larger than that of the individuals kept in isolation I2.
On the other hand, the relation between the number of asymptomatic staying infected individuals AS, and the number of individuals newly infected a day AP, that is the relation of ASAP, shows a convex curve in the first half, meaning ΔAP/ΔAS>1. This indicates that a small increase in the number of asymptomatic staying infected individuals induces a large increase in the number of individuals newly infected a day, and due to feedback, the increase in the number of infected individuals induces the increase in asymptomatic staying infected individuals in turn. In the second half the relation shows a concave curve, that considering the direction of the arrow, it could be understood to be ΔAS/ΔAP>1. This indicates that a small decrease in the number of individuals newly infected a day induces a large decrease in the number of asymptomatic staying infected individuals. For the relation of ASPI, since the number of isolated individuals is simply apportioned by 80% of the number of individuals newly infected a day, it shows a linear relation to the number of asymptomatic staying infected individuals (Figure 7).
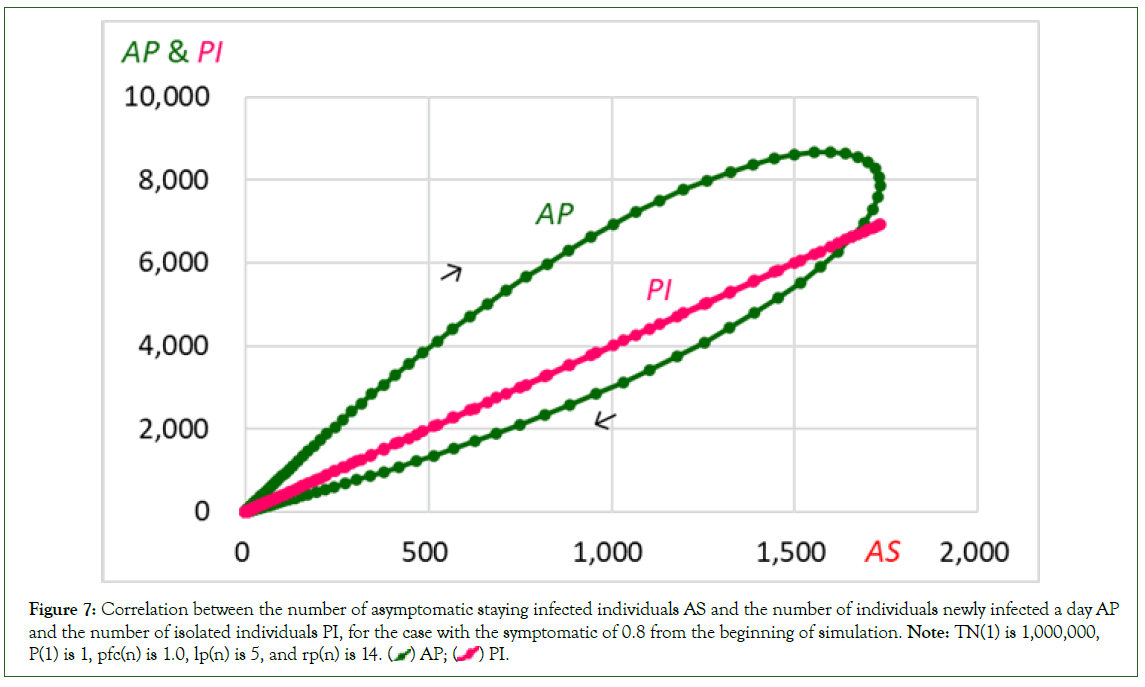
Figure 7: Correlation between the number of asymptomatic staying infected individuals AS and the number of individuals newly infected a day AP
and the number of isolated individuals PI, for the case with the symptomatic of 0.8 from the beginning of simulation. Note: TN(1) is 1,000,000,
P(1) is 1, pfc(n) is 1.0, lp(n) is 5, and rp(n) is 14. ( ) AP; (
 ) PI.
) PI.
As a result, the number of infected individuals P, reaches 73,678 at the peak on the 129th and then decreases to 0 on the 240th, with a total number of infected individuals of 336,096. Thus, when the symptomatic rate is set to 0.8, the date of the peak is considerably advanced, and the infection duration becomes considerably shorter. However, the number of infected individuals at the peak markedly increases, and the total number is also markedly larger. This indicates that the occurrence of asymptomatic staying infected individuals, which is induced by a symptomatic rate less than 1.0, could cause a rapid and large increase in the number of infected individuals, though the infection duration becomes short.
Changes in the number of infected individuals by different symptomatic rates
The important roles of the asymptomatic infections were noticed even before and/or at the beginning of the period of COVID-19 pandemic by Nishiura, et al., are showed the proportions of asymptomatic infections have been examined and analyzed, for example: The proportion of asymptomatic infections ranking from 1.4% to 78.3% and/or the weighted pooled proportion of asymptomatic infection of 25% and the weighted pooled average of asymptomatic infection between 28% and 31.4% [4-7]. The percentage of truly asymptomatic infections of 35.1% with a range from 19.7% in older individuals to 46.7% in children and 42.8% for a group comprising both asymptomatic and pre-symptomatic infections [8]. The proportion of people testing positive for COVID-19 who never developed symptoms ranging from 8.44% to 39% and relative risk of infection varying from 0.35 to 0.58 for contacts of asymptomatic cases and 0.63 for contacts of presymptomatic cases [9,10]. The pooled percentage of asymptomatic infections among the tested population was 0.25%, which was higher in nursing home residents or staff (4.52%), air or cruise travelers (2.02%) and pregnant women (2.34%). The pooled percentage of asymptomatic infections among the confirmed population was 40.50%, which was higher in pregnant women (54.11%), air or cruise travelers (52.91%) and nursing home residents or staff (47.53%). The pooled percentage of asymptomatic infections was 0.25% among the tested population and 40.50% among the confirmed population [11]. The asymptomatic transmission among familial clusters, adults, children and health care workers of 15.72%, 29.48%, 24.09% and 0%, respectively. Overall, asymptomatic transmission was 24.51% among all studied population groups [12]. The pooled percentage of asymptomatic infections was 32.40% among SARS-CoV-2 Omicron variantpositive individuals, which was higher in the population in developing countries (38.93%), with vaccine coverage ≥ 80% (35.93%), with a travel history (40.05%), community infection (37.97%) and with a median age<20 years (43.75%) [13]. The proportion of infections that are asymptomatic declines with age, falling from 42% in age group 0-9 years to 11% in age group greater than 60 years [14]. A mean proportion of asymptomatic infections could not be estimated due to high heterogeneity of data and/or the summary proportion asymptomatic was 19%. The secondary attack rate in contacts of people with asymptomatic infection compared with symptomatic infection was 0.32 and the proportion of all SARS-CoV-2 transmission from presymptomatic individuals was higher than from asymptomatic individuals, concluding that most SARS-CoV-2 infections were not persistently asymptomatic, and asymptomatic infections were less infectious than symptomatic infections [15].
As shown by the above investigations/analyses, although it surely plays an important role in spreading COVID-19 infection, the proportion of asymptomatic infections has been estimated to have a wide range from a few percent to about 60 percent with a maximum of about 80 percent, indicating that the symptomatic rate has also a wide range. Therefore, the simulations were performed for the symptomatic rates covering the whole range from 1.0 to 0.
Changes in the number of AP(n) (the number of individuals newly infected on date n) and CAP (the cumulative number of infected individuals up to date n=the cumulative number of individuals newly infected a day up to date n) by different symptomatic rates. As mentioned previously, when the symptomatic rate is 1.0, meaning that all the infected individuals become symptomatic and are isolated, the number of individuals newly infected a day AP, reaches 2,135 at the peak on the 191st and 192nd and then decreases to 0 on the 326th. The number of infected individuals P, reaches 14,895 at the peak on the 194th and then decreases to 0 on the 354th, with a total number of infected individuals of 141,788. However, when the symptomatic rate is 0.9, meaning that 90% of individuals newly infected on a day become symptomatic and are isolated, the number of infected individuals a day reaches 5,411 at the peak on the 145th. Out of 5,411 infected individuals, 541 individuals are asymptomatic and staying in the community and 4,870 individuals become symptomatic on the 150th and are isolated on the 151st. The number of infected individuals reaches 42,001 at the peak on the 149th and then decreases to 0 on the 274th, with a total number of infected individuals of 251,341. The number of infected individuals at the peak becomes markedly larger, though the date of the peak is considerably brought forward. The total number of infected individuals also becomes markedly larger, although the infection duration becomes considerably shorter (Table 2, Figure 8).
| AP: Infected/day | P: Infected | I2: Isolated | Total | ||||||||||
|---|---|---|---|---|---|---|---|---|---|---|---|---|---|
| Peak | Duration | Peak | Duration | Peak | Duration | RM | SRT: Recovered | CAP | |||||
| syr | Date | Number | Date-Date | Date | Number | Date-Date | Date | Number | Date-Date | Susceptible | Isolated | Community | Infected Total |
| 1.0 | 191-192 | 2,135 | 1-326 | 194 | 14895 | 1-354 | 201 | 19,107 | 7-365 | 858212 | 141788 | 0 | 141788 |
| 0.9 | 145 | 1-250 | 149 | 149 | 42001 | 1-274 | 155 | 43319 | 7-280 | 748659 | 226207 | 25134 | 251341 |
| 0.8 | 125 | 1-217 | 129 | 129 | 73678 | 1-240 | 135 | 61387 | 7-243 | 663904 | 268877 | 67219 | 336096 |
| 0.5 | 97 | 1-176 | 103 | 103 | 173623 | 1-200 | 107 | 71550 | 7-196 | 509765 | 245117 | 245118 | 490235 |
| 0.3 | 88 | 1-163 | 95 | 95 | 239318 | 1-188 | 98 | 51949 | 10-180 | 453386 | 163984 | 382630 | 546614 |
| 0.2 | 85 | 1-159 | 92 | 92 | 271742 | 1-184 | 95 | 37008 | 13-173 | 432831 | 113434 | 453735 | 567169 |
| 0.0 | 79 | 1-153 | 87 | 87 | 336268 | 1-178 | - | - | - | 401713 | o | 598287 | 598287 |
Table 2: The number of infected/day, infected, isolated, susceptible and recovered by different symptomatic rates (syr). Note: TN(1) is 1,000,000, P(1) is 1, pfc(n) is 1.0, lp(n) is 5 and rp(n) is 14.
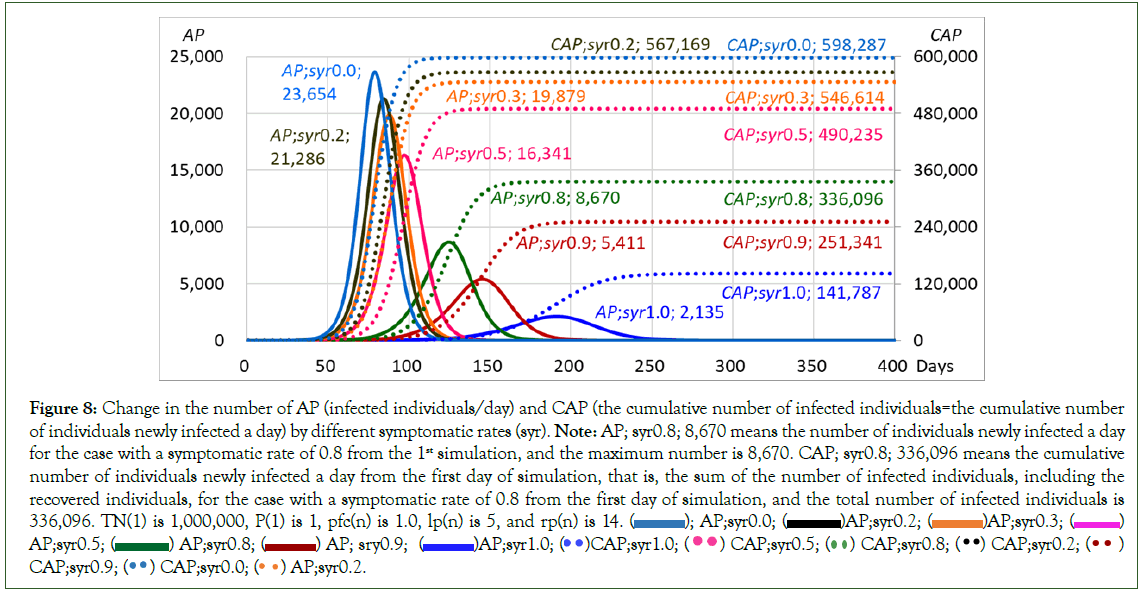
Figure 8: Change in the number of AP (infected individuals/day) and CAP (the cumulative number of infected individuals=the cumulative number
of individuals newly infected a day) by different symptomatic rates (syr). Note: AP; syr0.8; 8,670 means the number of individuals newly infected a day
for the case with a symptomatic rate of 0.8 from the 1st simulation, and the maximum number is 8,670. CAP; syr0.8; 336,096 means the cumulative
number of individuals newly infected a day from the first day of simulation, that is, the sum of the number of infected individuals, including the
recovered individuals, for the case with a symptomatic rate of 0.8 from the first day of simulation, and the total number of infected individuals is
336,096. TN(1) is 1,000,000, P(1) is 1, pfc(n) is 1.0, lp(n) is 5, and rp(n) is 14. ( ); AP;syr0.0; (
 )AP;syr0.2; (
 )AP;syr0.3; (
 )
AP;syr0.5; (
 ) AP;syr0.8; (
 ) AP; sry0.9; (
 )AP;syr1.0; (
 )CAP;syr1.0; (
  ) CAP;syr0.5; (
 ) CAP;syr0.8; (
  ) CAP;syr0.2; (
 )
CAP;syr0.9; (
 ) CAP;syr0.0; (
 ) AP;syr0.2.
When the symptomatic rate is 0.5, meaning that half of the infected individuals become symptomatic and are isolated, the number of newly infected individuals a day reaches 16,342 at the peak on the 97th. Half of it 8,171 is asymptomatic and stays in the community, and the remaining half becomes symptomatic on the 102nd and is isolated on the 103rd. The number of infected individuals reaches 173,623 at the peak on the 103rd and then decreases to 0 on the 200th, with a total number of infected individuals of 490,235.
When the symptomatic rate is 0.3, meaning that 30% of the infected individuals become symptomatic and are isolated, the number of newly infected individuals a day reaches 19,879 at the peak on the 88th. Out of 19,879 infected individuals 5,964 individuals become symptomatic on the 93rd and are isolated on the 94th and the rest 13,915, are asymptomatic and staying in the community. The number of infected individuals reaches 239,318 at the peak on the 95th and then decreases to 0 on the 188th, with a total number of infected individuals of 546,614.
As examined above, with a decrease in the symptomatic rate, the number of infected individuals markedly increases though the infection duration becomes markedly short (Table 2). The relations between the symptomatic rate (syr) and the number of individuals newly infected a day AP. At the peak, the number of infected individuals P, at the peak and the total number of infected individuals CAP. The number of infected individuals markedly increases with a decrease in the symptomatic rate. Although they show non-linear relations, when syr decreases by 0.1, the peak number of AP increases by approximately 4,000, the peak number of P increases by approximately 35,000 and the total number of infected individuals increases by approximately 100,000 individuals in the first half from 1 to 0.5 of syr (Figure 9).
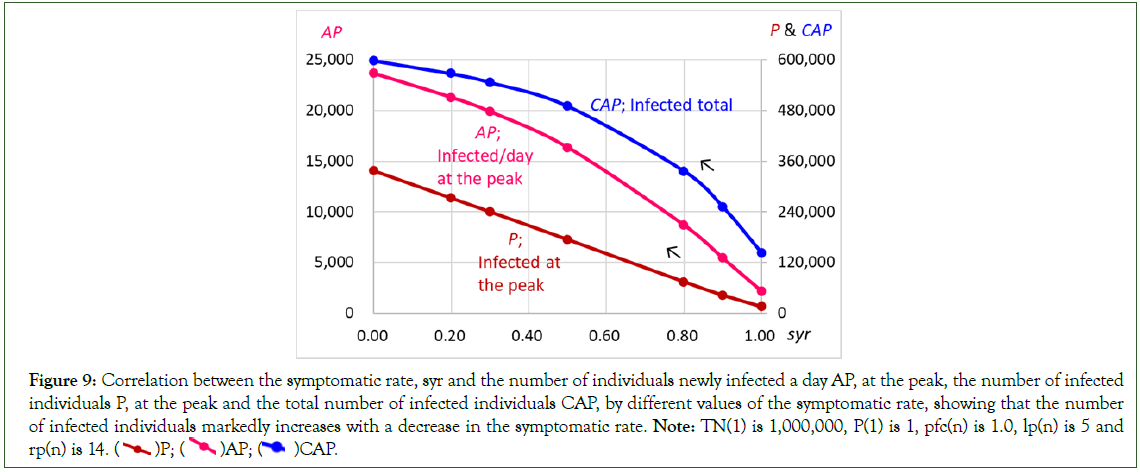
Figure 9: Correlation between the symptomatic rate, syr and the number of individuals newly infected a day AP, at the peak, the number of infected
individuals P, at the peak and the total number of infected individuals CAP, by different values of the symptomatic rate, showing that the number
of infected individuals markedly increases with a decrease in the symptomatic rate. Note: TN(1) is 1,000,000, P(1) is 1, pfc(n) is 1.0, lp(n) is 5 and
rp(n) is 14. ( )P; (
)P; ( )AP; (
 )CAP.
)CAP.
Changes in the number of the population excluding the number of individuals kept in isolation and its relation to the change in the number of individuals newly infected a day by different symptomatic rates
As previously explained (Population excluding the individuals kept in isolation), the change in the number of isolated individuals induces the change in the population. Since the symptomatic rate controls the change in the number of isolated individuals, the symptomatic rate controls the change in the population (Figure 10).
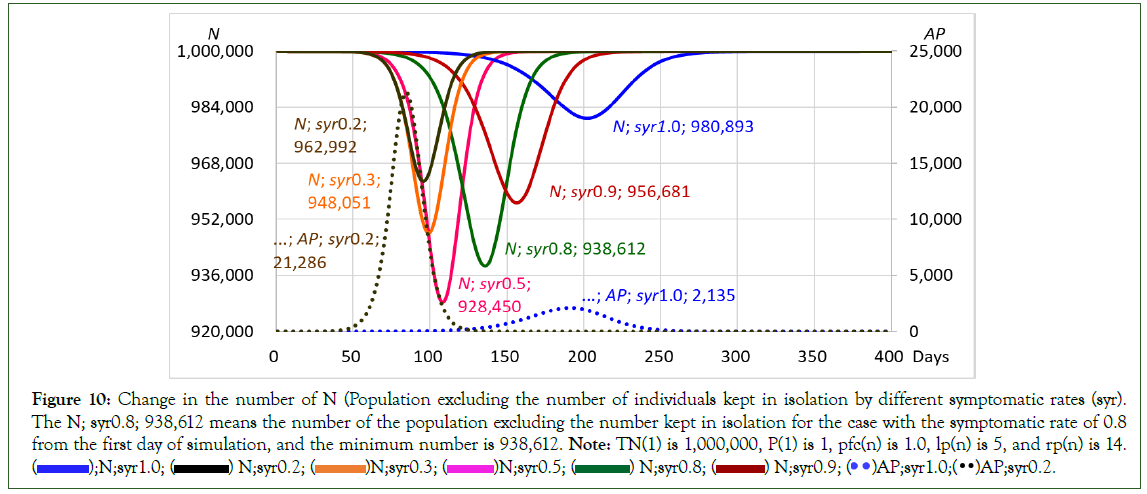
Figure 10: Change in the number of N (Population excluding the number of individuals kept in isolation by different symptomatic rates (syr).
The N; syr0.8; 938,612 means the number of the population excluding the number kept in isolation for the case with the symptomatic rate of 0.8
from the first day of simulation, and the minimum number is 938,612. Note: TN(1) is 1,000,000, P(1) is 1, pfc(n) is 1.0, lp(n) is 5, and rp(n) is 14.
( );N;syr1.0; (
 ) N;syr0.2; (
 )N;syr0.3; (
 )N;syr0.5; (
 ) N;syr0.8; (
 ) N;syr0.9; (
 )AP;syr1.0;(
 )AP;syr0.2.
When the syr is set to 1.0 through the simulation, N(n) decreases down to 981,124 on the 206th and then recovers to 1,000,000 on the 366th. When syr is set to 0.9, the minimum value of the population is 956,681 at the bottom on the 156th and then recovers to 1,000,000 on the 281st. When syr is set to 0.8, the minimum value of the population is 938,613 at the bottom on the 136th and then recovers to 1,000,000 on the 244th. When syr is set to 0.5, the minimum value of the population is 928,450 at the bottom on the 108th and then recovers to 1,000,000 on the 197th. It shows the smallest value among all cases with different symptomatic rates (Figure 10).
When syr is set to 0.3, the minimum value of the population is 948,051 at the bottom on the 99th and then recovers to 1,000,000 on the 181st. The minimum value has increased, though the date of the bottom became brought forward. When syr is set to 0.2, the minimum value of the population is 962,992 at the bottom on the 96th and then recovers to 1,000,000 on the 174th. Therefore, the minimum value of the population for the individual symptomatic rate decreases with a decrease in the symptomatic rate, reaches 928,450 for the symptomatic rate of 0.5 and then increases.
The correlation between the symptomatic rate (syr) and the minimum population N (Figure 11). The correlation shows a concave curve with a bottom. The value of N decreases with a decrease in the value of syr, reaching 928,450 at the bottom when the value of syr is 0.5. After the bottom, the value of N increases with a decrease in the value of syr. When the symptomatic rate is set to 0, since any infected individuals are not symptomatic, are asymptomatic and are not isolated, the population does not decline, keeping the initial population at 1,000,000 (Figure 11).
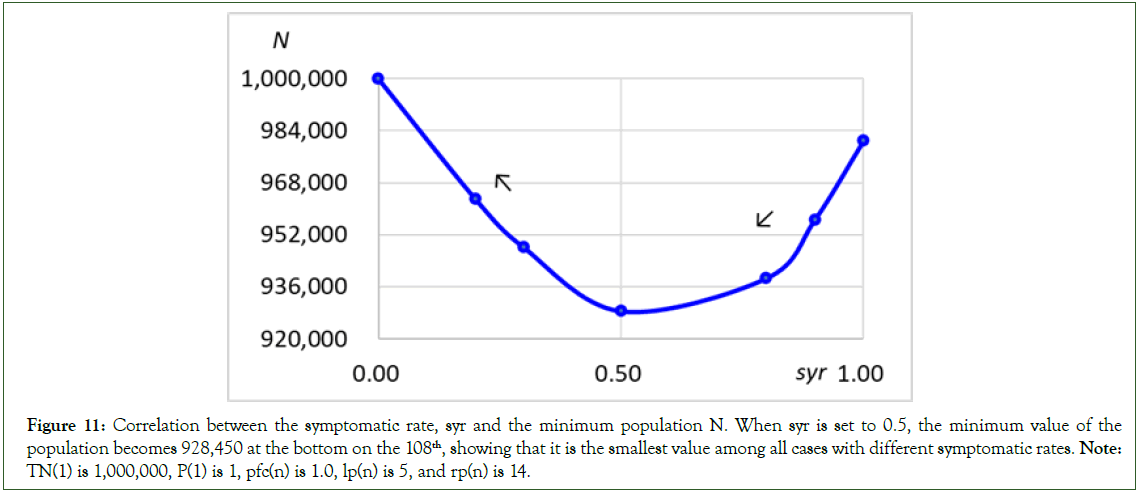
Figure 11: Correlation between the symptomatic rate, syr and the minimum population N. When syr is set to 0.5, the minimum value of the population becomes 928,450 at the bottom on the 108th, showing that it is the smallest value among all cases with different symptomatic rates. Note: TN(1) is 1,000,000, P(1) is 1, pfc(n) is 1.0, lp(n) is 5, and rp(n) is 14.
The population excluding the isolated individuals and the dead affects the contact rate between infected individuals and susceptible individuals because the contact rate is used as the ratio such as S(n)/N(n) and R(n)/N(n), where N(n) is the population excluding the isolated individuals and the dead but including the recovered individuals having returned to the community, S(n) is the number of susceptible individuals in the community and R(n) is the number of recovered individuals having returned to the community. Thus, the decrease in N is expected to increase the contact rate, resulting in an increase in the number of infected individuals.
The relation between the populations excluding the individuals kept in isolation N and the number of individuals newly infected a day AP, shows a non-linear relation for every symptomatic rate. For each symptomatic rate in the first half and the relation shows a convex curve, meaning ΔAP/(-ΔN)>1. This indicates that a small decrease in N induces a large increase in AP, and due to feedback, the increase in AP induces a decrease in N in turn. Here, for a symptomatic rate, the decrease in N increases the contact rate, resulting in an increase in AP. In the second half, the relation shows a concave curve for every symptomatic rate. Considering their curvature, however, since each curve shows an almost straight line for a large part, it could be understood that the relation is in negative proportion, indicating that AP decreases simply with an increase in N, though the slopes of the curves are different from one another (Figure 12).
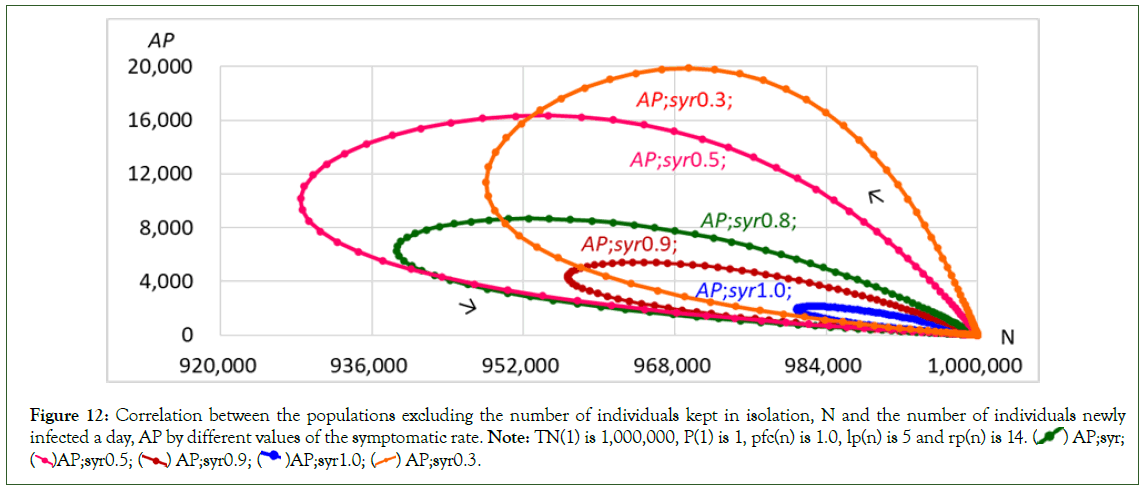
Figure 12: Correlation between the populations excluding the number of individuals kept in isolation, N and the number of individuals newly
infected a day, AP by different values of the symptomatic rate. Note: TN(1) is 1,000,000, P(1) is 1, pfc(n) is 1.0, lp(n) is 5 and rp(n) is 14. ( ) AP;syr;
(
 )AP;syr0.5; (
 ) AP;syr0.9; (
  )AP;syr1.0; (
 ) AP;syr0.3.
On the other hand, when the symptomatic rate is reduced, the number of infected individuals markedly increases due to the increase in the number of staying infected individuals themselves. The increase in the number of individuals infected by the staying infected individuals causes a large number of individuals to be isolated due to being symptomatic and this large number of isolated individuals causes a marked decrease in the population, though the population slightly increases for the period just after the symptomatic rate is set (Figure 4).
Herd immunity
When the value of the symptomatic rate is set to 0.0, all infected individuals are not symptomatic and are not isolated without any intervention. They stay in the community and continue infecting susceptible individuals until the recovery period is ended, and then they become recovered individuals who have immunity in the community. For such a case, the number of infected individuals increases to a peak and then decreases. This phenomenon is explained by herd immunity, which is indirect protection against the spread of infection caused by the immunity of a large proportion of the population. The contact rate between infected individuals and susceptible individuals should be reduced by increasing the number of recovered individuals who have immunity. As a result, although the decreases in the number of susceptible individuals surely induce the decrease in the number of infected individuals, the number of infected individuals must be considerably decreased due to the increase in the number of recovered individuals. This is scientific proof of the idea of herd immunity, the cumulative number of infected individuals at the peak, which is the turning point of the infected individuals from increasing to decreasing, is one of the herd immunity thresholds, being a target value for vaccination. Although the herd immunity threshold was examined by Ohmori [1]. Since there were wrong numbers in the values of threshold pointed out, the herd immunity is reexamined here, correcting the wrong numbers, the results of simulation by different values of pfc (Table 3, Figure 13).
| AP: Infected/day | Infected | Total | ||||||||||
|---|---|---|---|---|---|---|---|---|---|---|---|---|
| Peak | Duration | Peak | Duration | |||||||||
| Sfr:syr | Date | Number | ΣInfected | ΣRecovered | Date-Date | Date | Number | ΣInfected | ΣRecovered | Date-Date | Susceptible | Infected |
| Pfc 1/syr1/AL1 | 191 192 |
2135 |
76961 79096 | 46734 48544 | 1-326 |
194 |
14895 |
83,343 |
52280 |
1-354 |
858212 |
141788 |
| Pfc 1/syr1/AL0 | 197 198 |
2875 | 104281 107156 |
63594 66035 |
1-345 | 201 | 20059 | 115736 | 73657 | 1-376 | 803362 | 196638 |
| Pfc 1/syr1/AL1 | 79 | 23655 | 300807 | 47982 | 1-153 | 87 | 336268 | 466620 | 147823 | 1-178 | 401713 | 598287 |
| Pfc 1/syr1/AL0 | 80 | 24891 | 333964 | 56112 | 1-175 | 87 | 356804 | 488423 | 149462 | 1-206 | 325107 | 674893 |
| Pfc 1/syr1/AL1 | 42 | 58221 | 398087 | 6118 | 1-88 | 50 | 655265 | 714026 | 79425 | 1-108 | 190041 | 809959 |
| Pfc 1/syr1/AL0 | 42 | 58475 | 398954 | 6118 | 1-106 | 50 | 660549 | 719327 | 79456 | 1-126 | 156616 | 843384 |
Table 3: The number of infected individuals by different pfcs when syr is set to 1 and 0.0. Recovered for the case with a syr of 1 indicates the individuals who became symptomatic, then were isolated and recovered after the isolation period and returned to the community. Recovered for the case with a syr of 0 indicates the individuals who were not symptomatic, were not isolated, stayed in the community and recovered after the recovery period. ΣInfected indicates the cumulative number of infected individuals up to the peak, and ‘ΣRecovered’ indicates the cumulative number of recovered individuals up to the peak. Total indicates the total number on the last day of the duration of the Infected. Note: TN (1) is 1,000,000 P (1) is 1, lp(n) is 5 and rp(n) is 14.
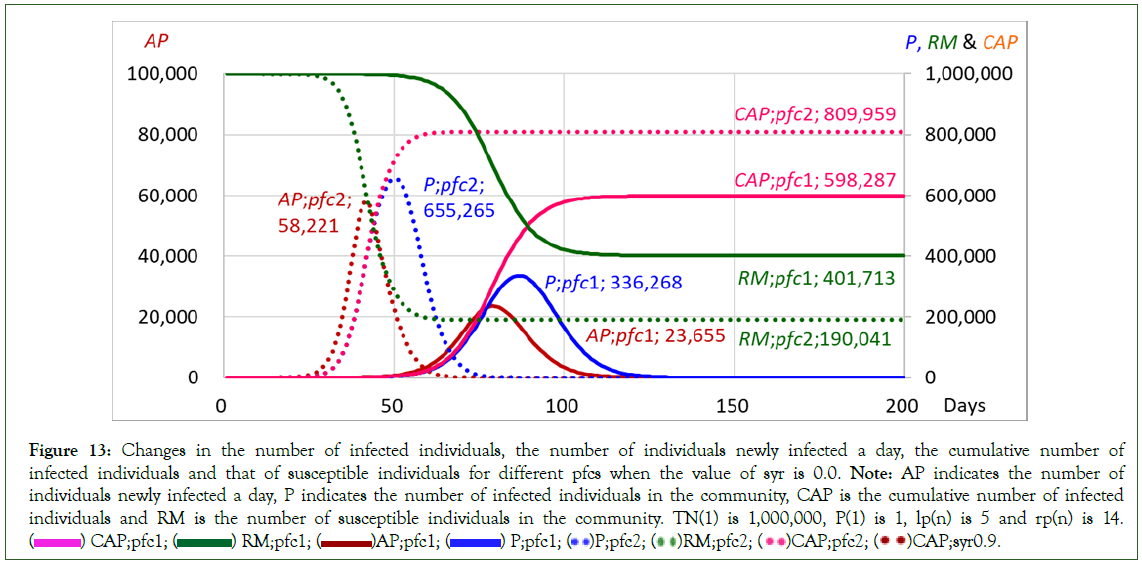
Figure 13: Changes in the number of infected individuals, the number of individuals newly infected a day, the cumulative number of
infected individuals and that of susceptible individuals for different pfcs when the value of syr is 0.0. Note: AP indicates the number of
individuals newly infected a day, P indicates the number of infected individuals in the community, CAP is the cumulative number of infected
individuals and RM is the number of susceptible individuals in the community. TN(1) is 1,000,000, P(1) is 1, lp(n) is 5 and rp(n) is 14.
( ) CAP;pfc1; (
 ) RM;pfc1; (
 )AP;pfc1; (
  ) P;pfc1; (
 )P;pfc2; (
 )RM;pfc2; (
 )CAP;pfc2; (
 )CAP;syr0.9.
When the value of pfc is 1.0, the number of individuals newly infected a day AP, reaches 23,655 at the peak on the 79th, with a cumulative number of 300,807 and then decreases to 0 on the 153rd. The number in parentheses with a strikethrough line is the wrong number in the article by Ohmori [1]. The number of infected individuals P, reaches 336,268 at the peak on the 87th, with a cumulative number of 466,620. After the peak, the number of infected individuals decreases to 0 on the 178th, with a total number of infected individuals of 598,287.
However, as previously examined, when pfc is 1.0 and syr is 1.0, meaning that all the infected individuals become symptomatic and are isolated, the number of individuals newly infected a day AP, reaches 2,135 at the peak on the 191st and the 192nd with a cumulative number of 76,961 on the 191st and 79,096 on the 192nd, and then decreases to 0 on the 326th. The number of infected individuals P, reached 14,895 at the peak on the 194th with a cumulative number of 83,343. After the peak, the number of infected individuals decreases to 0 on the 354th, with a total number of infected individuals of 141,788 (Table 3). This indicates that when the symptomatic rate is set to 0, the numbers of infected individuals become markedly large.
On the other hand, when the value of pfc is 2.0, the number of individuals newly infected a day reaches 58,221 at the peak on the 42nd with a cumulative number of 398,087 and then decreases to 0 on the 88th. The number of infected individuals reached 655,265 at the peak on the 50th, with a cumulative number of 714,026. After the peak, the number of infected individuals decreases to 0 on the 108th with a total number of infected individuals of 809,959.
Each of the numbers 466,620, approximately 47% of the population for a syr of 1, and 714,026, approximately 71% of the population for a syr of 2, is a potential herd immunity threshold without any intervention. Although potential herd immunity could be achieved sooner than expected, it is surely achieved only at the cost of so many infected individuals with so much death.
Now, when the symptomatic rate is set to 0, since any infected individuals are not isolated and stay in the community, the population of the community does not change, indicating that the effect of the change in population on the spread of COVID-19 can be ignored. The change in the number of newly infected individuals AP and the change in the number of recovered individuals having been in the community RAS, by different pfc (Figure 14). The change in the number of recovered individuals follows the change in the number of newly infected individuals 15 days later. The time lag of 15 days means the time interval between when the newly infected individuals were infected and when they have recovered in the community, that is the time interval of the recovery period+1(=rp+1) days, for the purpose of calculation. The peak of AP(n) is located just behind the date when the number of recovered individuals starts to increase, suggesting that the rapid decrease in the number of infected individuals is induced by the increase in the number of recovered individuals.
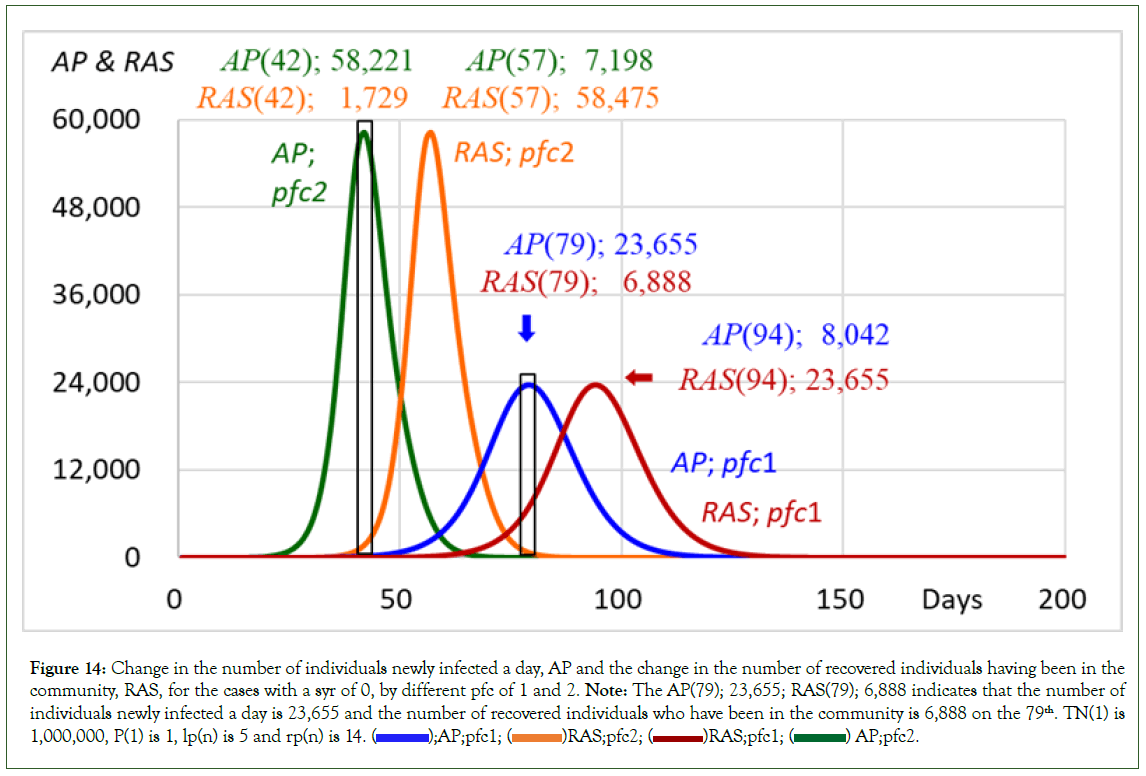
Figure 14: Change in the number of individuals newly infected a day, AP and the change in the number of recovered individuals having been in the
community, RAS, for the cases with a syr of 0, by different pfc of 1 and 2. Note: The AP(79); 23,655; RAS(79); 6,888 indicates that the number of
individuals newly infected a day is 23,655 and the number of recovered individuals who have been in the community is 6,888 on the 79th. TN(1) is
1,000,000, P(1) is 1, lp(n) is 5 and rp(n) is 14. ( );AP;pfc1; (
 )RAS;pfc2; (
 )RAS;pfc1; (
 ) AP;pfc2.
The relation between the number of recovered individuals in the community RAS and the number of newly infected individuals AP, for the cases with a syr of 0 by different pfc (Figure 15).
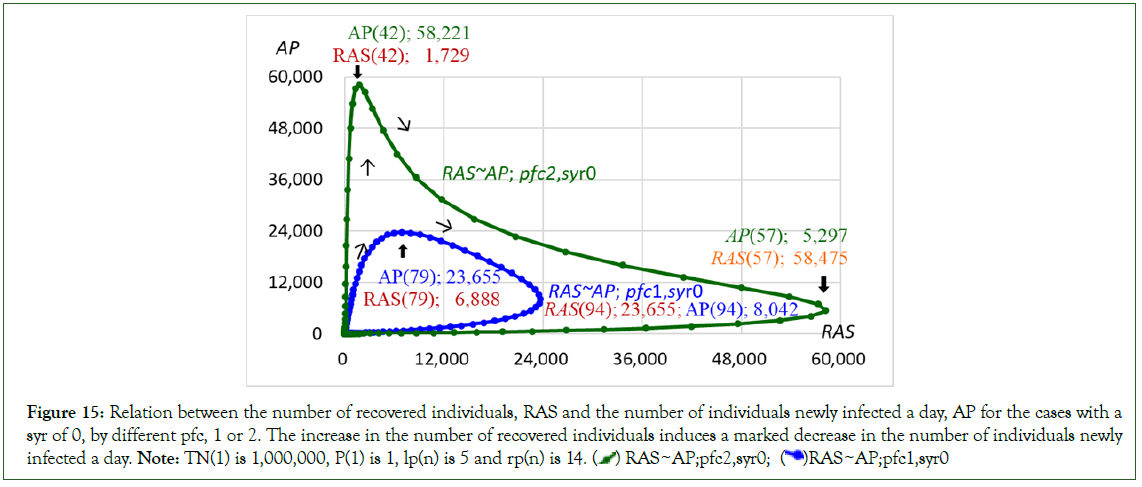
Figure 15: Relation between the number of recovered individuals, RAS and the number of individuals newly infected a day, AP for the cases with a
syr of 0, by different pfc, 1 or 2. The increase in the number of recovered individuals induces a marked decrease in the number of individuals newly
infected a day. Note: TN(1) is 1,000,000, P(1) is 1, lp(n) is 5 and rp(n) is 14. ( ) RAS~AP;pfc2,syr0; (
 )RAS~AP;pfc1,syr0
Since the number of recovered individuals is 0 or a few during the early stage of infection, the number of newly infected individuals rapidly increases and reaches a peak. After the peak, with an increase in the number of recovered individuals, the number of newly infected individuals decreases. The number of newly infected individuals has become considerably small on the date when the number of recovered individuals reaches the peak. After the peak of the number of recovered individuals, the effect of the recovered individuals weakens; then, the number of newly infected individuals slowly decreases to 0.
From another point of view, as explained by Equation (20), when the value of AL(n) is given by 1, the activity of the recovered individuals is the same level as that of the susceptible individuals, indicating that the reduction effect of the recovered individuals on the contact rate between infected individuals and susceptible individuals is counted in the calculation for simulation. However, when the value of AL(n) is set to 0, the recovered individuals are not active, meaning that the reduction effect of the recovered individuals on the contact rate is left out of the calculation and the case such as this with an AL(n) of 0 is called the ‘Modified SIR model’ by Ohmori [1]. For the SIR model created by Kermack and McKendrick [16,17]. The infected individuals continue infecting in the community throughout the recovered period and the population used in calculation does not change throughout the infection duration, while for the Modified SIR model, the infected individuals continue infecting in the community not throughout the recovered period but during the latent period, and the population used in calculation is changed even for the case when AL(n) is set to 0. The results of the calculation for the cases with an AL of 0 (Table 3, Figure 16).
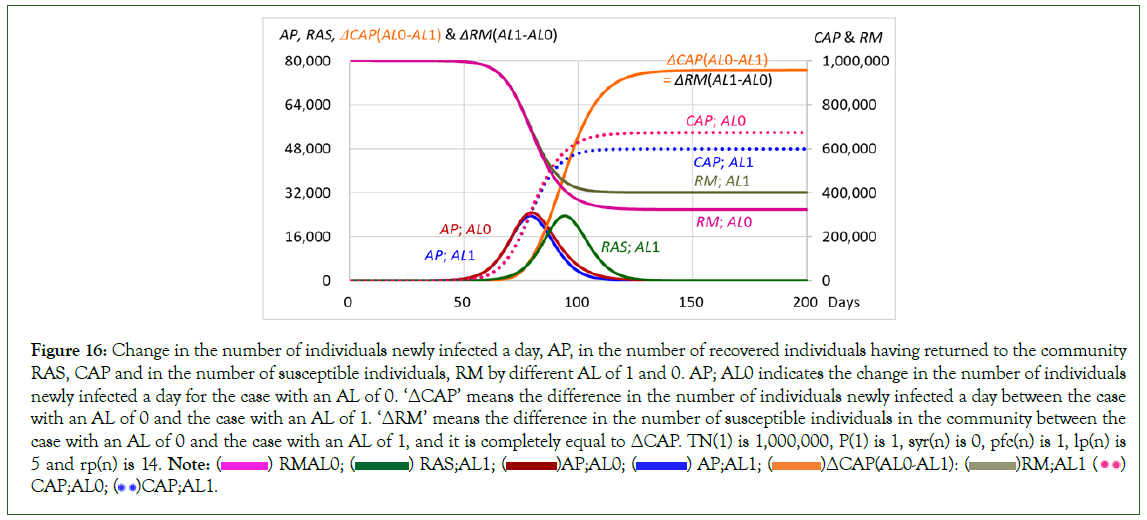
Figure 16: Change in the number of individuals newly infected a day, AP, in the number of recovered individuals having returned to the community
RAS, CAP and in the number of susceptible individuals, RM by different AL of 1 and 0. AP; AL0 indicates the change in the number of individuals
newly infected a day for the case with an AL of 0. ‘ΔCAP’ means the difference in the number of individuals newly infected a day between the case
with an AL of 0 and the case with an AL of 1. ‘ΔRM’ means the difference in the number of susceptible individuals in the community between the
case with an AL of 0 and the case with an AL of 1, and it is completely equal to ΔCAP. TN(1) is 1,000,000, P(1) is 1, syr(n) is 0, pfc(n) is 1, lp(n) is
5 and rp(n) is 14. Note: ( ) RMAL0; (
 ) RAS;AL1; (
 )AP;AL0; (
 ) AP;AL1; (
 )ΔCAP(AL0-AL1): (
 )RM;AL1 (
 )
CAP;AL0; (
 )CAP;AL1.
When the AL is set to 0, the number of newly infected individuals is larger than that of the case with an AL of 1 throughout the infection duration. The difference in the number of individuals newly infected a day between the case with an AL of 0 and the case with an AL of 1, ΔCAP, rapidly increases with an increase in the number of recovered individuals (Figure 16).
The relation between the number of recovered individuals, RAS and the difference ΔCAP. The cumulative number of infected individuals CAP, rapidly increases with an increase in the number of recovered individuals in the first half and slowly increases with decreases in the number of recovered individuals in the second half. The difference in the number of individuals newly infected a day between the case without the reduction effect of the recovered individuals AL of 0, and the case with the reduction effect of the recovered individual AL of 1, increases rapidly in proportion to the number of recovered individuals with a slope of approximately 1.7 in the first half and increases slowly in negative proportion to the number of recovered individuals with a slope of approximately 1.1 in the second half. This indicates that the reduction in the incidence of infection is considerably induced by the recovered individual (Figure 17).
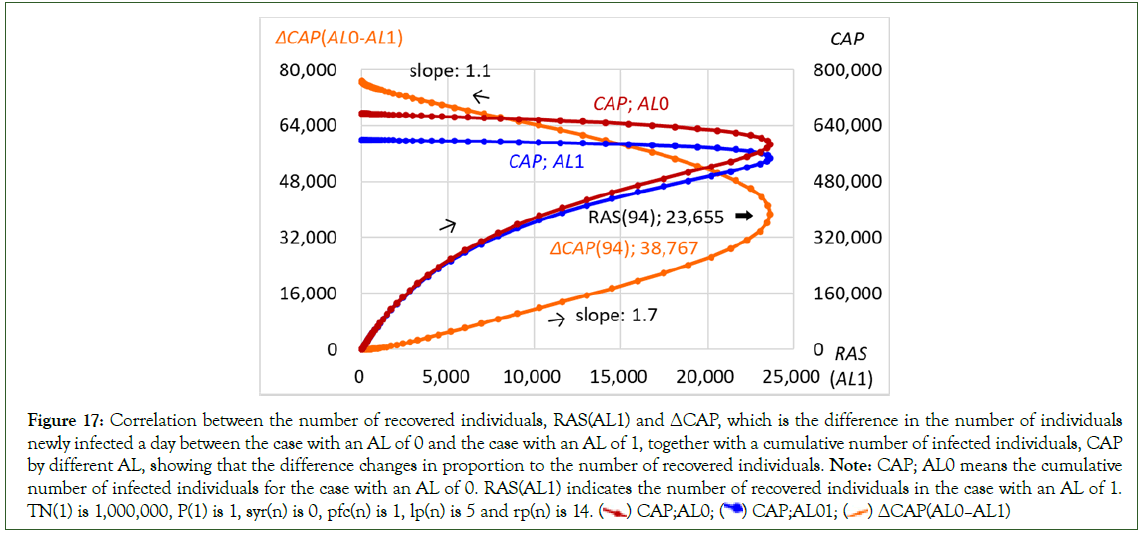
Figure 17: Correlation between the number of recovered individuals, RAS(AL1) and ΔCAP, which is the difference in the number of individuals
newly infected a day between the case with an AL of 0 and the case with an AL of 1, together with a cumulative number of infected individuals, CAP
by different AL, showing that the difference changes in proportion to the number of recovered individuals. Note: CAP; AL0 means the cumulative
number of infected individuals for the case with an AL of 0. RAS(AL1) indicates the number of recovered individuals in the case with an AL of 1.
TN(1) is 1,000,000, P(1) is 1, syr(n) is 0, pfc(n) is 1, lp(n) is 5 and rp(n) is 14. ( ) CAP;AL0; (
 ) CAP;AL01; (
 ) ΔCAP(AL0–AL1)
The correlations between the number of susceptible individuals remaining in the community RM and the difference in the number of individuals newly infected a day between the case without the reduction effect of the recovered individuals (AL of 0) and the case with the reduction effect of the recovered individual (AL of 1), ΔCAP and between the number of susceptible individuals and the number of recovered individuals RAS. The number of recovered individuals RAS, increases with a decrease in the number of susceptible individuals. At the same time, the difference ΔCAP is also increases with a decrease in the number of susceptible individuals, indicating that the increase in the number of recovered individuals induces a decrease in the number of individuals newly infected a day (Figure 18).
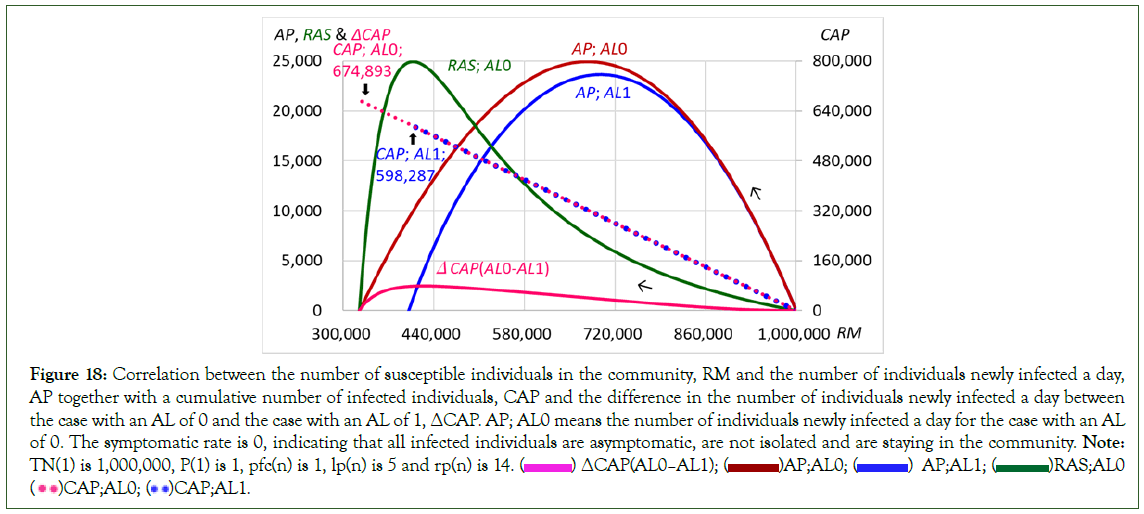
Figure 18: Correlation between the number of susceptible individuals in the community, RM and the number of individuals newly infected a day,
AP together with a cumulative number of infected individuals, CAP and the difference in the number of individuals newly infected a day between
the case with an AL of 0 and the case with an AL of 1, ΔCAP. AP; AL0 means the number of individuals newly infected a day for the case with an AL
of 0. The symptomatic rate is 0, indicating that all infected individuals are asymptomatic, are not isolated and are staying in the community. Note: TN(1) is 1,000,000, P(1) is 1, pfc(n) is 1, lp(n) is 5 and rp(n) is 14. ( ) ΔCAP(AL0–AL1); (
 )AP;AL0; (
 ) AP;AL1; (
 )RAS;AL0
(
 )CAP;AL0; (
 )CAP;AL1.
In addition, for verification the total number of infected individuals shows a linear line for each case with an AL of 1 or 0, indicating being in proportion to the number of susceptible individuals. The difference in the total number of infected individuals between the two cases is 76,606 (=654,893-598,387), indicating that when the reduction effect by the recovered individuals is ignored, the increment in the infected individuals reaches approximately 13%.
Furthermore, when the value of the symptomatic rate is set to 1.0, the number of individuals newly infected a day AP, the number of recovered individuals who were isolated RT, the cumulative number of infected individuals CAP and the difference in the number of individuals newly infected a day between the case with an AL of 0 and the case with an AL of 1, ΔCAP, are considerably smaller than those of the cases with a symptomatic rate of 0. However, the difference in the total number of infected individuals between the case with an AL of 0 and the case with an AL of 1 is 54,850 (=196,638-141,788), indicating that when the reduction effect by the recovered individuals is ignored, the increment in the infected individuals reaches approximately 39% (Table 3, Figure 19).
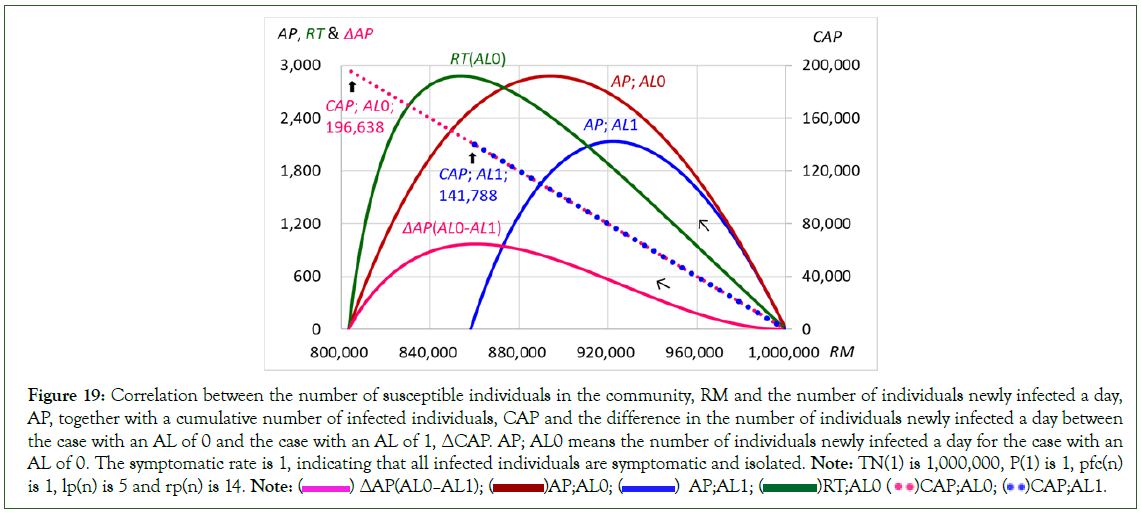
Figure 19: Correlation between the number of susceptible individuals in the community, RM and the number of individuals newly infected a day,
AP, together with a cumulative number of infected individuals, CAP and the difference in the number of individuals newly infected a day between
the case with an AL of 0 and the case with an AL of 1, ΔCAP. AP; AL0 means the number of individuals newly infected a day for the case with an
AL of 0. The symptomatic rate is 1, indicating that all infected individuals are symptomatic and isolated. Note: TN(1) is 1,000,000, P(1) is 1, pfc(n)
is 1, lp(n) is 5 and rp(n) is 14. Note: ( ) ΔCAP(AL0–AL1); (
 )AP;AL0; (
 ) AP;AL1; (
 )RT;AL0
(
 )CAP;AL0; (
 )CAP;AL1.
Changes in the number of infected individuals caused by changes in the number of isolated individuals due to political and medical interventions
For the flexible model used here, the symptomatic infected individuals among the infected individuals in the community are isolated. Thus, the symptomatic rate indicates the ratio of the number of isolated individuals. Namely, the symptomatic rate is practically used as the isolation rate for the individuals infected a day. The appearance of symptoms commonly depends on the characteristics of the virus and the health conditions of infected individuals. Therefore, the isolation rate also depends on the characteristics of the virus and the health conditions of infected individuals. However, sometimes, the number of isolated individuals is controlled/decided by political and medical interventions for some reasons induced by the capacity of hospital care and others. Namely, in some circumstances, some political and medical interventions could be taken to control the number of isolated individuals at any time throughout the infection duration. For such cases, the same things could occur as the symptomatic rate is set/changed in the middle of the infection duration.
As previously noted, when the symptomatic rate is set to 1, the number of individuals newly infected a day reaches 2,135 at the peak on the 191st and 192nd and then decreases to 0 on the 326th, with a total number of infected individuals of 141,788. When the symptomatic rate is changed from 1 to 0.8 on the 201st, the number of individuals newly infected a day decreases from 2,135 to 1,995 on the 200th with a cumulative number of infected individuals of 95,696 and further to 1,706 on the 207th with a cumulative number of infected individuals of 108,574, then increases again to 2,210 at the second peak on the 228th with a cumulative number of infected individuals of 151,034. After the second peak, the number of individuals newly infected a day decreases to 0 on the 397th with a total number of infected individuals of 228,640, approximately 1.6 times larger than that of the case without any change in the symptomatic rate. The total number of infected individuals of the first term to the 200th is 95,696 and that of the second term is 132,950 (Table 4, Figure 20).
| AP: Infected/day | P: Infected | I2: Isolated | Total | CAP: Infected Total | ||||||||||
|---|---|---|---|---|---|---|---|---|---|---|---|---|---|---|
| Peak | Duration | Peak | Duration | Peak | Duration | RM | I2:Recovered | |||||||
| syr | Date | Number | Date-Date | Date | Number | Date-Date | Date | Number | Date-Date | Susceptible | Isolated (CRI+CRT) | Community(CRAS) | Cummulative | Each Term |
| syr 1 | 191-192 | 2135 | 1-326 | 194 | 14895 | 1-354 | 201 | 19107 | 7-365 | 858212 | 141788 | 0 | 141788 | 141788 |
| syr (1100)1: | 100 | 58 | 1-100 | 100 | 347 | 1-100 | 100 | 309 | 7-100 | 998887 | 1,113 | 0 | 1,113 | 1,113 |
| syr (101)0.8 | 170 | 8570 | 101-263 | 174 | 72828 | 101-286 | 180 | 60704 | 101-289 | 665245 | 268027 | 66728 | 334755 | 333642 |
| syr (1-150)1: | 150 | 703 | 1-150 | 150 | 4317 | 1-150 | 150 | 4015 | 7-150 | 985239 | 14,761 | 0 | 14761 | 14761 |
| syr (151)0.8 | 195 | 7420 | 151-294 | 199 | 63331 | 151-319 | 205 | 52650 | 151-322 | 681209 | 257985 | 60806 | 318791 | 304030 |
| syr (1-200)1: | 191-192 | 2135 | 1-200 | 194 | 14895 | 1-200 | 201 | 19,107 | 7-200 | 904304 | 95696 | - | 95696 | 95696 |
| syr (201-)0.8 | 228 | 2210 | 201-397 | 232 | 19266 | 201-439 | 219 | 12713 | 201-441 | 771354 | 202056 | 26590 | 228646 | 132950 |
| syr (1-250)1: | 191-192 | 2135 | 1-250 | 194 | 14895 | 1-250 | 201 | 19107 | 7-250 | 860142 | 139858 | 0 | 139,858 | 139858 |
| syr (251-)0.8 | 261-263 | 88 | 250-827 | 266 | 776 | 251-1029 | 279 | 616 | 251-586 | 845546 | 151535 | 2919 | 154,454 | 14596 |
| syr (1-300)1: | 191-192 | 2135 | 1-300 | 194 | 14895 | 1-300 | 201 | 19107 | 7-300 | 858255 | 141745 | 0 | 141745 | 141745 |
| syr (301)0.8 | 301 | 3 | 301-784 | 314-326 | 17 | 1-1500 | 301 | 68 | 301-1440 | 857569 | 142294 | 137 | 142431 | 686 |
| syr 0.8 | 125 | 8670 | 1-217 | 129 | 73678 | 1-240 | 135 | 61387 | 7-243 | 6639041 | 268877 | 67219 | 336096 | 336096 |
| syr (1-250)1: | 191-192 | 2135 | 1-250 | 194 | 14895 | 1-250 | 201 | 19107 | 7-250 | 860142 | 139858 | 0 | 139858 | 139858 |
| syr (1-250)0.5 | 351 | 2030 | 251-546 | 357 | 23083 | 251-601 | 361 | 9102 | 251-586 | 692316 | 223771 | 83913 | 307684 | 167826 |
| syr (1-300)1: | 191-192 | 2135 | 1-300 | 194 | 14895 | 1-300 | 201 | 19107 | 7-300 | 858255 | 141745 | 0 | 141745 | 141745 |
| syr (301-)0.5 | 488 | 1866 | 301-690 | 494 | 21232 | 301-748 | 498 | 8267 | 301-732 | 696154 | 222795 | 81051 | 303846 | 162101 |
| syr (1-300)1: | 191-192 | 2135 | 1-300 | 194 | 14895 | 1-300 | 201 | 19107 | 7-300 | 858255 | 141745 | 0 | 141745 | 141745 |
| syr (301-)0.0 | 413 | 7238 | 301-534 | 420 | 111397 | 301-573 | - | 0 | - | 528994 | 0 | 329261 | 471006 | 329261 |
Table 4: The number of infected individuals by different syr setting date when the symptomatic rate is set. Note: Isolated of I2: Recovered indicates the individuals who became symptomatic, then were isolated and recovered after the isolation period and returned to the community, while Community of I2: Recovered indicates the individuals who were not symptomatic, were not isolated, stayed in the community and recovered after the recovery period. Total indicates the total number on the last day of the duration of the Infected. syr (1-300)1; syr (301-)0.5 indicates that the symptomatic rate (syr) is 1 from the 1st to the 300th and syr is 0.5 for the period from the 301st to the end of infection duration.
TN(1) is 1,000,000; P(1) is 1; pfc(n) is 1.0; lp(n) is 5; rp(n) is 14.
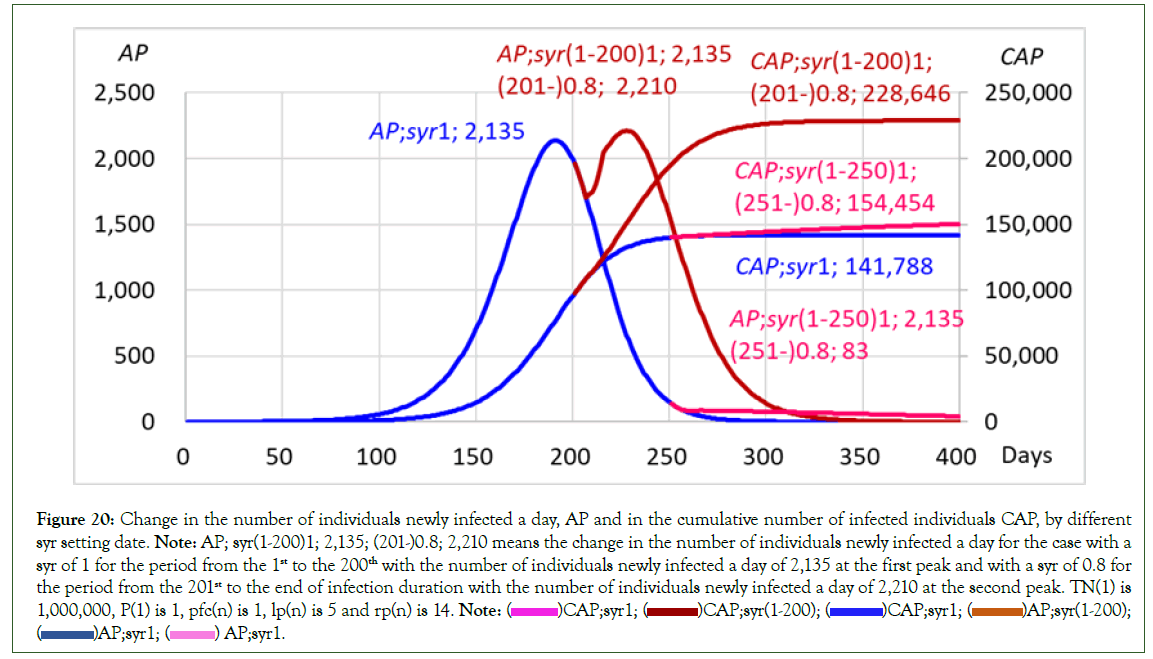
Figure 20: Change in the number of individuals newly infected a day, AP and in the cumulative number of infected individuals CAP, by different
syr setting date. Note: AP; syr(1-200)1; 2,135; (201-)0.8; 2,210 means the change in the number of individuals newly infected a day for the case with a
syr of 1 for the period from the 1st to the 200th with the number of individuals newly infected a day of 2,135 at the first peak and with a syr of 0.8 for
the period from the 201st to the end of infection duration with the number of individuals newly infected a day of 2,210 at the second peak. TN(1) is
1,000,000, P(1) is 1, pfc(n) is 1, lp(n) is 5 and rp(n) is 14. Note: ( )CAP;syr1; (
 )CAP;syr(1-200); (
 )CAP;syr1; (
 )AP;syr(1-200);
(
 )AP;syr1; (
 ) AP;syr1.
On the other hand, when the symptomatic rate is changed on the 251st from 1 to 0.8, the number of individuals newly infected a day decreases from 2,135 to 149 on the 250th with a cumulative number of infected individuals of 139,858 and further to 83 on the 262nd with a cumulative number of infected individuals of 141,063, then increases slightly to 88 at the second peak on the 266th with a cumulative number of infected individuals of 141,401. After the second peak, the number of newly infected individuals decreased to 0 on the 827th with a total number of infected individuals of 154,454, approximately 1.1 times larger than that of the case without any change in the symptomatic rate. The infection duration, which ends when the infected individual and the isolated individual disappears for the purpose of calculation, is 1,029 days, indicating that the duration becomes extremely long. The total number of infected individuals of the first term to the 250th is 139,858 and that of the second term is 14,596, indicating that the effect of reduction of the symptomatic rate becomes less. When the symptomatic rate is changed on the 300th from 1 to 0.8, the number of individuals newly infected a day decreases from 2,135 to 3 on the 300th with a cumulative number of infected individuals of 141,745 and further to 0 on the 784th without any peak. The total number of infected individuals is 142,430. Although the infection duration of 1,500 days, becomes markedly longer, the total number of infected individuals only slightly increases from 141,788 to 142,430. As examined above, the earlier the reduced symptomatic rate is set, the more the number of infected individuals increases (Table 4, Figure 20).
When the symptomatic rate is reduced from 1 to 0.5 on the 301st, the number of individuals newly infected a day surely decreases from 2,135 at the peak to 3 on the 300th with a cumulative number of infected individuals of 141,745, suggesting that the infection has almost subsided. The number of individuals newly infected a day decreases further to 2 for the period from the 305th to the 311th. After the bottom, however, the number of individuals newly infected a day rapidly increases up to 1,866 at the second peak on the 488th. Then, the number of individuals newly infected a day decreases down to 0 on the 690th with a total number of infected individuals of 303,846, indicating that the total number of infected individuals for the second term after the 301st is 162,101. It is more than that of the first term, 141,745. The infection duration was as long as 748 days (Table 4, Figure 21).
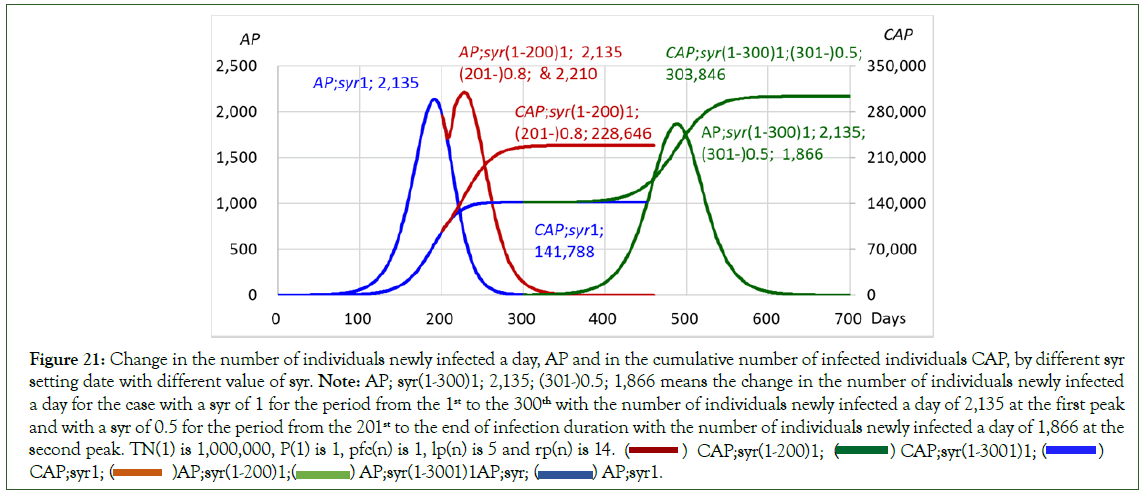
Figure 21: Change in the number of individuals newly infected a day, AP and in the cumulative number of infected individuals CAP, by different syr
setting date with different value of syr. Note: AP; syr(1-300)1; 2,135; (301-)0.5; 1,866 means the change in the number of individuals newly infected
a day for the case with a syr of 1 for the period from the 1st to the 300th with the number of individuals newly infected a day of 2,135 at the first peak
and with a syr of 0.5 for the period from the 201st to the end of infection duration with the number of individuals newly infected a day of 1,866 at the
second peak. TN(1) is 1,000,000, P(1) is 1, pfc(n) is 1, lp(n) is 5 and rp(n) is 14. ( ) CAP;syr(1-200)1; (
 ) CAP;syr(1-3001)1; (
 )
CAP;syr1; (
 )AP;syr(1-200)1;(
 ) AP;syr(1-3001)1AP;syr; (
 ) AP;syr1.
Furthermore, when the symptomatic rate is reduced from 1 to 0.0 on the 301st, meaning that any newly infected individuals are not isolated and are staying in the community, the number of individuals newly infected a day decreases from 2,135 at the peak to 3 on the 300th with a cumulative number of infected individuals of 141,745, suggesting that the infection has almost subsided, as mentioned previously. The number of individuals newly infected a day decreases further to 2 for the period from the 305th to the 308th. After the bottom, the number of individuals newly infected a day rapidly increases up to 7,238 at the second peak on the 413th. Then, the number of individuals newly infected a day decreases down to 0 on the 534th with a total number of infected individuals of 471,006, indicating that the total number of infected individuals for the second term after the 301st is 329,261. It is approximately 3 times larger than that of the first term 141,745. The infection duration becomes as long as 573 days. Thus, a large reduction in the symptomatic rate, meaning a large decrease in the number of isolated individuals and a large increase in the number of infected individuals staying in the community, must cause a serious spread of infection with a longer infection duration, even if the reduced symptomatic rate is set at a late time in the infection duration (Figure 22).
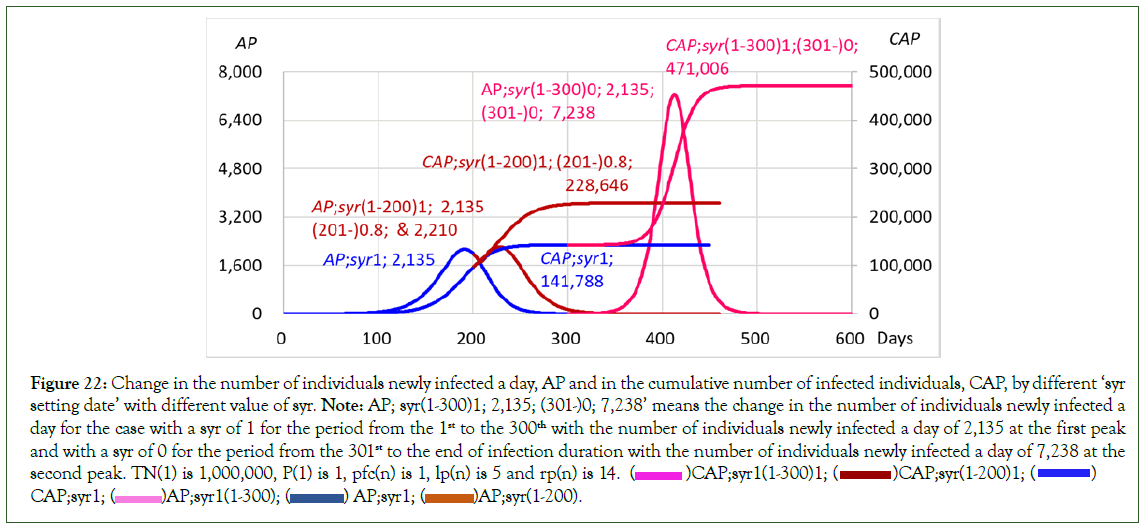
Figure 22: Change in the number of individuals newly infected a day, AP and in the cumulative number of infected individuals, CAP, by different ‘syr
setting date’ with different value of syr. Note: AP; syr(1-300)1; 2,135; (301-)0; 7,238’ means the change in the number of individuals newly infected a
day for the case with a syr of 1 for the period from the 1st to the 300th with the number of individuals newly infected a day of 2,135 at the first peak
and with a syr of 0 for the period from the 301st to the end of infection duration with the number of individuals newly infected a day of 7,238 at the
second peak. TN(1) is 1,000,000, P(1) is 1, pfc(n) is 1, lp(n) is 5 and rp(n) is 14. ( )CAP;syr1(1-300)1; (
 )CAP;syr(1-200)1; (
 )
CAP;syr1; (
 )AP;syr1(1-300); (
 ) AP;syr1; (
 )AP;syr(1-200).
Effect of vaccination on spreading of infection for cases with different symptomatic rates
The number of individuals newly infected on date n, AP(n(night)), is given by the following equation:
AP(n(night))=p(n) × RM(n) …………(34)
Where, RM(n) is the number of susceptible individuals in the community and given by:
RM(n)=TN(n)–(CI(n)+CAP(n)+V(n)) …………(35)
p(n) is the infection coefficient and given by:
p(n)=(pfc(n)/lp(n)) × (RM(n)/N(n)) × icf(n) × (1–(AL(n)/N(n))) × (RP(n)/N(n)) ……………(36)
AL(n) is the sum of the activity levels of the recovered individuals and vaccinated ones, given by:
AL(n)=alI(n) × (CRI(n)+CRT(n))+al(n) × CRAS(n)+alV(n) × V(n)...(37)
Where, the coefficient alV(n) is the activity level of the vaccinated individuals and V(n) is the number of vaccinated individuals who have immunity as the recovered individuals do.
When the number of vaccinated individuals V, increases, the number of susceptible individuals RM, decreases as calculated by Equation (35), and thus Equation (34) indicates that the increase in the number of vaccinated individuals directly decreases the number of individuals newly infected a day, AP.
On the other hand, the contact rate (cr(n)) between the infected individuals and susceptible ones is given by:
cr(n)=(S(n)/N(n))(1-δ(R(n)/N(n))).............(38)
Where (1–δ(R(n)/N(n))) is the reduction rate, and as previously explained,
(1–δ(R(n)/N(n)))=(1-(all(n)×(CRT(n))+al(n)×)CRAS(n)+alV(n) × V(n))/N(n))=(1-(AL(n)/N(n))).....39
The reduction effect on the contact rate increases with a decreasing value of (1–δ(R(n)/N(n)). Namely, Equation (39) indicates that when the number of vaccinated individuals increases, the reduction rate decreases, inducing a reduction in the contact rate. Consequently, the increase in vaccinated individuals decreases not only the number of susceptible individuals but also the value of the contact rate.
Under the condition that the latent period is 5 days, the recovery period is 14 days, the initial population of the community is 1,000,000 and the initial number of infected individuals is 1, when the symptomatic rate (syr), is set to 0.8 and the vaccination rate is 0, meaning that the number of vaccinated individuals is 0, the number of individuals newly infected a day reaches 8,670 at the peak on the 125th and then decreases to 0 on the 217th with a total number of infected individuals of 336,096 (Table 5, Figure 23).
| AP: Infected/day | P: Infected | I2: Isolated | Total | ||||||||||||
|---|---|---|---|---|---|---|---|---|---|---|---|---|---|---|---|
| Peak | Duration | Peak | Duration | Peak | Duration | RM | SRT: Recovered | CAP | V | Δ | |||||
| Syr/v | Date | Number | Date-Date | Date | Number | Date-Date | Date | Number | Dat-Date | Suspectible | Isolated (CRI+CRT) | Community (CRAS) | Infected Total | Vaccinated | Difference |
| syr 1 | 191-192 | 2,135 | 1-326 | 194 | 14,895 | 1-354 | 201 | 19107 | 7-365 | 858212 | 141788 | 0 | 141788 | 0 | 0 |
| Syr1:(101);v0.01 | 200-201 | 1419 | 1-362 | 203 | 9910 | 1-100 | 210 | 12722 | 7-409 | 857842 | 114158 | 0 | 114158 | 10000 | -27630 |
| syr1:(101)0.8 | 170 | 8570 | 1-263 | 174 | 72828 | 1-281 | 180 | 60704 | 7-289 | 665245 | 268027 | 66728 | 334755 | 0 | 0 |
| syr1:(101)0.8;(101~)v0.01 | 174 | 7248 | 1-274 | 178 | 61867 | 1-299 | 184 | 51446 | 7-302 | 683695 | 245267 | 61038 | 306305 | 10000 | -28450 |
| syr 0.8 | 125 | 8670 | 1-217 | 129 | 73678 | 1-240 | 135 | 61387 | 7-243 | 663904 | 268877 | 67219 | 336096 | 0 | 0 |
| Syr 0.8; (101~)v0.01 | 125 | 7574 | 1-223 | 129 | 64614 | 1-247 | 135 | 53729 | 7-250 | 679016 | 248787 | 62197 | 310984 | 10000 | -25112 |
Table 5: The number of infected individuals by different syr setting date with different vaccination rates v, 0 or 0.01. syr1;(101-)0.8; (101~)v0.01 indicates that the symptomatic rate syr is 1 for the period from the 1st to the 100th, syr is 0.8 and v is 0.01 for the period from the 101st to the end of infection duration. Note: TN(1) is 1,000,000, P(1) is 1, pfc(n) is 1.0, lp(n) is 5 and rp(n) is 14.
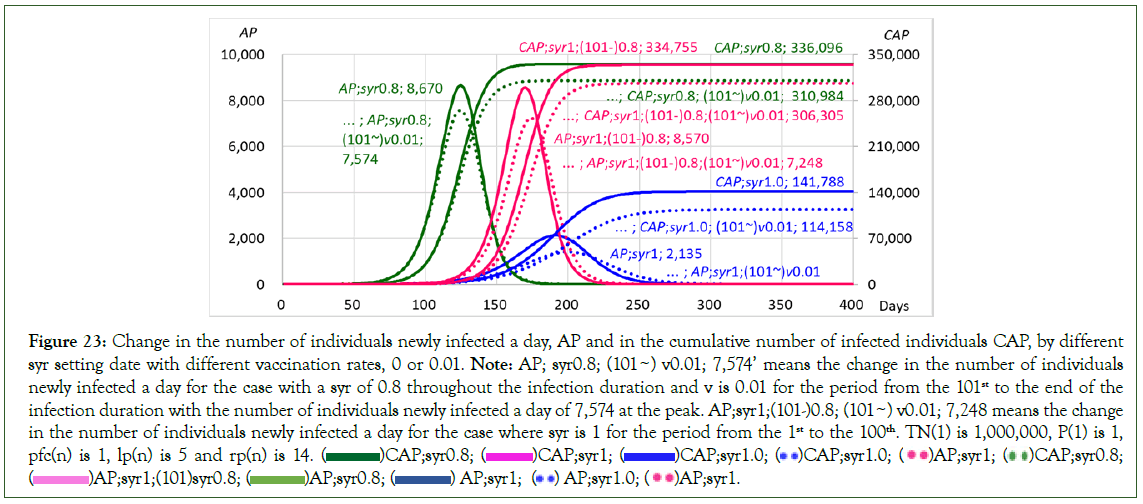
Figure 23: Change in the number of individuals newly infected a day, AP and in the cumulative number of infected individuals CAP, by different
syr setting date with different vaccination rates, 0 or 0.01. Note: AP; syr0.8; (101~) v0.01; 7,574’ means the change in the number of individuals
newly infected a day for the case with a syr of 0.8 throughout the infection duration and v is 0.01 for the period from the 101st to the end of the
infection duration with the number of individuals newly infected a day of 7,574 at the peak. AP;syr1;(101-)0.8; (101~) v0.01; 7,248 means the change
in the number of individuals newly infected a day for the case where syr is 1 for the period from the 1st to the 100th. TN(1) is 1,000,000, P(1) is 1,
pfc(n) is 1, lp(n) is 5 and rp(n) is 14. ( )CAP;syr0.8; (
 )CAP;syr1; (
 )CAP;syr1.0; (
 )CAP;syr1.0; (
 )AP;syr1; (
 )CAP;syr0.8;
(
  )AP;syr1;(101)syr0.8; (
 )AP;syr0.8; (
 ) AP;syr1; (
 ) AP;syr1.0; (
 )AP;syr1.
However, when the vaccination rate v, is 0.01, not on and after the first day but on and after the 101st, meaning that the vaccinated individuals are just 10,000 on and after the 101st, the number of individuals newly infected a day reached 7,574 at the peak on the 125th and then decreased to 0 on the 223rd with a total number of infected individuals of 310,984, indicating 25,112 less than that of the case with no vaccination. For other cases with different symptomatic rates, each case shows that the number of individuals newly infected a day and the total number of infected individuals are both markedly smaller than those of the case without any vaccinated individuals. As examined above, vaccination is considerably effective in decreasing the number of infected individuals even for cases with a symptomatic rate less than 1, even though a ‘symptomatic rate less than 1’ causes a marked increase in the number of infected individuals.
Effect of PCR test on spreading of infection for the case with different symptomatic rates
The number of individuals confirmed to be infected due to being test positive CP(n), is given by:
CP(n)=T(n) × bp(n) × ir(n)=T(n) × tir(n) …………..(40)
Where, T(n) is the number of individuals having PCR test and the antibody test, which people can set arbitrarily on any days when tests are performed, and the coefficient bp(n) is the magnification of incidence rate for the test to the incidence rate ir(n), in the community. The incident rate ir(n), is given by:
ir(n)=P(n)/TN(n) ………………..(41)
Where, P(n) is the number of infected individuals already having existed in the community, though P(1) is the initial number of infected individuals in the community and is arbitrarily given by individual. TN(n) is the population of the whole community.
The coefficient tir(n) is the positive rate for the PCR test and is given by:
tir(n)=bp(n) × ir(n) ……………..(42)
As previously explained, since all the individuals confirmed to be infected due to test positivity are not always isolated and the individuals decided to be isolated I (n), are isolated on the following day of the date when they are confirmed to be infected, in the actual calculation, I(n) is given by:
I(n)=CP(n–1) × i(n–1) …………(43)
Where the coefficient i(n) is the isolation rate for the individuals who are confirmed to be infected due to being test positive. i(n) indicates the ratio of the number of isolated individuals to the total number of infected individuals confirmed. When all the individuals confirmed to be infected due to a positive test are isolated, the value of i(n) should be set to 1.
The population excluding the individuals kept in isolation and dead in the real community N(n), is given by:
N(n)=TN(n–1)–(CI(n–1)+CPI(n–1)+CDAS(n–1)+CDT(n– 1))+CRI(n–1)+CRT(n–1) …………(44)
Where CI(n–1) is ΣI(n–1), meaning the cumulative number of individuals isolated due to being test positive up to the date (n–1). Since most of the individuals who are confirmed to be infected due to test positivity are isolated from the community, the PCR test causes changes in the population and in the number of isolated individuals.
When the test is started on the 101st under the condition that the magnification (bp(n)) is 5, the isolation rate (i(n)) is 1, meaning that all the infected individuals confirmed are isolated, the latent period is 5 days, the recovery period is 14 days, the population of the community is 1,000,000 and the initial number of infected individuals is 1, the changes in the number of infected individuals and isolated individuals (Table 6, Figure 24).
| AP: Infected/day | P: Infected | I2: Isolated | Total | |||||||||||
|---|---|---|---|---|---|---|---|---|---|---|---|---|---|---|
| Peak | Duration | Peak | Duration | Peak | Duration | RM | SRT: Recovered | CAP | Δ | |||||
| syr/T | Date | Number | Date-Date | Date | Number | Date-Date | Date | Number | Date-Date | Susceptible | Isolated (CRI+CRT) | Community (CRAS) | Infected total | Difference |
| syr 1 | 191-192 | 2,135 | 1-326 | 194 | 14,895 | 1-354 | 201 | 19107 | 7-365 | 858212 | 141788 | 0 | 141788 | 0 |
| syr 1;(101-)T1000 | 197-198 | 1393 | 1-354 | 201 | 9778 | 1-388 | 208 | 13166 | 7-400 | 886861 | 113139 | 0 | 113139 | -28649 |
| syr1;(101-)0.8 | 170 | 8570 | 1-263 | 174 | 72828 | 1-281 | 180 | 60704 | 7-289 | 665245 | 268027 | 66728 | 334755 | 0 |
| syr1;(101-)0.8;(101-)T1000 | 174 | 7126 | 1-267 | 177 | 61084 | 1-290 | 183 | 54661 | 7-295 | 694203 | 247442 | 58355 | 305797 | -28958 |
| syr0.8 | 125 | 8670 | 1-217 | 129 | 73678 | 1-240 | 135 | 61387 | 7-243 | 663904 | 268877 | 67219 | 336096 | 0 |
| syr0.8;(101-)T1000 | 124 | 7534 | 1-216 | 128 | 64450 | 1-239 | 134 | 53730 | 7-243 | 688181 | 251913 | 59906 | 311819 | -24277 |
Table 6: The number of infected individuals by different syr setting date with different numbers in tested individuals, T, 0 or 1,000. syr1;(101-)0.8; (101-)
T1,000 indicates that the symptomatic rate syr, is 1 for the period from the 1st to the 100th and syr is 0.8 and T(n) is 1,000 for the period from the 101st to
the end of infection duration.
Note: TN(1) is 1,000,000; P(1) is 1, pfc(n) is 1.0; lp(n) is 5; rp(n) is 14.
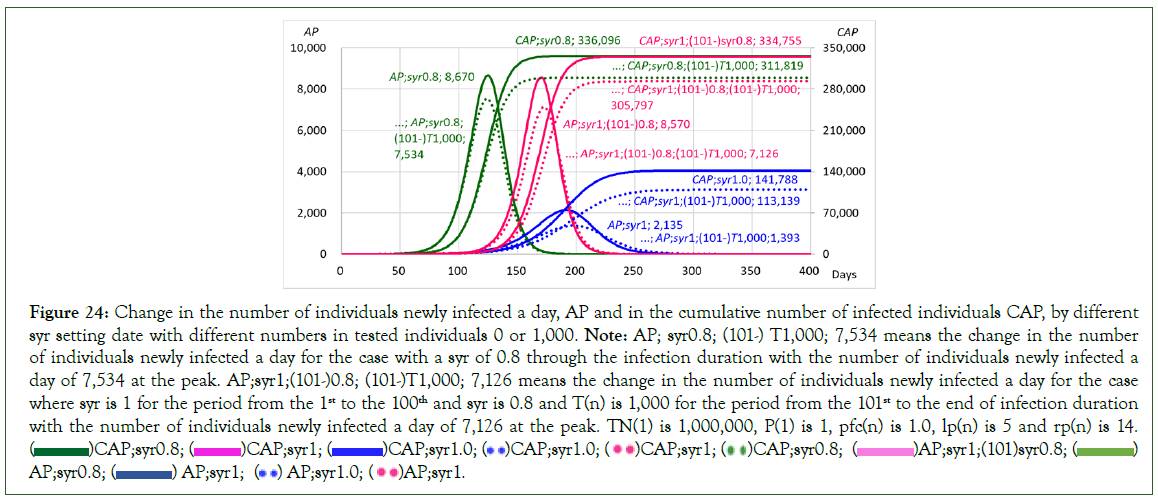
Figure 24: Change in the number of individuals newly infected a day, AP and in the cumulative number of infected individuals CAP, by different
syr setting date with different numbers in tested individuals 0 or 1,000. Note: AP; syr0.8; (101-) T1,000; 7,534 means the change in the number
of individuals newly infected a day for the case with a syr of 0.8 through the infection duration with the number of individuals newly infected a
day of 7,534 at the peak. AP;syr1;(101-)0.8; (101-)T1,000; 7,126 means the change in the number of individuals newly infected a day for the case
where syr is 1 for the period from the 1st to the 100th and syr is 0.8 and T(n) is 1,000 for the period from the 101st to the end of infection duration
with the number of individuals newly infected a day of 7,126 at the peak. TN(1) is 1,000,000, P(1) is 1, pfc(n) is 1.0, lp(n) is 5 and rp(n) is 14.
( )CAP;syr0.8; (
 )CAP;syr1; (
 )CAP;syr1.0; (
 )CAP;syr1.0; (
 )AP;syr1; (
 )CAP;syr0.8;
(
  )AP;syr1;(101)syr0.8; (
 )AP;syr0.8; (
 ) AP;syr1; (
 ) AP;syr1.0; (
 )AP;syr1.
When the symptomatic rate (syr), is set to 0.8, the number of individuals newly infected a day reaches 8,670 at the peak on the 125th and then decreases to 0 on the 217th, with a total number of infected individuals of 336,096. However, when the test with just 1,000 tested individuals is started not on the first day but on the 101st, meaning that 1,000 individuals are tested every day on and after the 101st, the number of individuals newly infected a day reached 7,534 at the peak on the 124th and then decreased to 0 on the 216th with a total number of infected individuals of 311,819, indicating 24,277 less than that of the case with no test. For other cases with different symptomatic rates, each case shows that the number of individuals newly infected a day and the total number of infected individuals are both markedly smaller than those of the case without any tested individuals. Therefore, it can be said that the PCR test and isolation treatment is considerably effective in decreasing the number of infected individuals even for cases with a symptomatic rate less than 1, even though a symptomatic rate less than 1 causes a marked increase in the number of infected individuals.
Conclusion
For COVID-19, when infected individuals become symptomatic after the latent period ends, they should be isolated from the community. Thus, the number of infected individuals isolated is controlled by the symptomatic rate. However, when the infected individuals do not become symptomatic even after the latent period, they are not isolated. The number of infected individuals staying in the community is also controlled by the symptomatic rate because the asymptomatic rate is given by the 1-symptomatic rate. Therefore, the symptomatic rate is used not only for recognizing the number of symptomatic infected individuals but also for recognizing the number of isolated and staying in the community infected individuals. Namely, the symptomatic rate is practically used as the isolation rate. For the isolated infected individuals, after the latent period, they do not infect susceptible individuals in the community. For the staying in the community infected individuals. However, they continue to infect susceptible individuals during the recovery period, inducing an increase in the number of infected individuals. Although the appearance of symptoms commonly depends on the characteristics of the virus and the health conditions of infected individuals, there are cases where the number of isolated individuals is decided by some political and medical interventions, such as the capacity of hospital care. For such cases, the symptomatic rate and the isolation rate is artificially controlled. Therefore, the evaluation of the effect of the symptomatic rate could provide reference materials for political and medical measures. Then, the cases with different symptomatic rates were examined under the condition that the initial population TN(1), is 1,000,000, the initial number of infected individuals P(1) is 1, the potential (biological) infectious capacity of coronavirus pfc(n) is 1.0, the latent period lp(n) is 5, and the recovery period rp(n) is 14. At the same time, herd immunity, the effects of vaccination and the PCR test on the spread of COVID-19 were evaluated based on the changes in the infected individuals simulated by the flexible compartment model. They are summarized as follows:
• When the symptomatic rate is less than 1.0, some infected individuals stay and continue infecting susceptible individuals in the community. Thus, a symptomatic rate less than 1 causes an increase in the number of infected individuals. When the symptomatic rate is 0.8, 80% of individuals newly infected on a day become symptomatic and are isolated, and the remaining 20% are asymptomatic and stay in the community. Since the asymptomatic infected individuals continue infecting susceptible individuals in the community until the recovered period is ended, the number of individuals newly infected a day reaches 8,670 at the peak on the 125th, approximately 4 times larger than that 2,135 at the peak on the 191st of the case with a syr of 1. Then, the number of individuals infected a day decreases to 0 on the 217th, with a total number of infected individuals of 336,096. It is approximately 2.4 times larger than that, 141,788, of the case with a syr of 1. Namely, the occurrence of asymptomatic staying infected individuals caused by a symptomatic rate less than 1 could induce a rapid and large increase in the number of infected individuals, though the infection duration becomes short.
• When the symptomatic rate is 1.0, meaning that all the infected individuals become symptomatic and are isolated, the infection duration is 354 days, and the total number of infected individuals is 141,788. However, when the symptomatic rate is 0.9, the infection duration becomes 274 days, and the total number of infected individuals reaches 251,341. The total number markedly increases, though the infection duration becomes considerably short. When the symptomatic rate is 0.5, meaning that half of the infected individuals become symptomatic and are isolated, the infection duration becomes 200 days, and the total number of infected individuals reaches 490,235, indicating that approximately half of the population has been infected. When the symptomatic rate is 0.3, the infection duration is shortened to 188 days, with a total number of infected individuals of 546,614, over half of the population. With a decrease in the symptomatic rate, the number of infected individuals markedly increases in a negative proportion to the change in the symptomatic ate, although the infection duration becomes markedly short.
• The number of isolated infected individuals and staying in the community infected individuals control the change in the population of the community. The population excluding the isolated individuals and the dead affects the contact rate between infected individuals and susceptible individuals, and the decrease in the population increases the contact rate, resulting in an increase in the number of infected individuals. This indicates that a small decrease in the population induces a large increase in the number of individuals newly infected a day in the first half of the infection duration. However, in the second half with an increase in population, the number of individuals newly infected a day decreases simply in negative proportion. On the other hand it is notable that when the symptomatic rate is reduced less than 1, the number of infected individuals markedly increases due to the increase in the number of staying infected individuals themselves. The large number of individuals infected by staying infected individuals causes a large number of the individuals to be isolated due to being symptomatic, inducing a marked decrease in the population, resulting in a marked increase in the number of infected individuals.
• When the symptomatic rate is set to 0, all the infected individuals do not become symptomatic and are not isolated, stay in the community that infect susceptible individuals until the recovery period is ended and then become recovered individuals who have immunity in the community. For such a case, the number of infected individuals increases to a peak and then decreases. This phenomenon is explained by herd immunity. An accelerated deduction in the contact rate between the infected individuals and the susceptible ones is induced by an increase in the number of recovered individuals. As a result, the number of infected individuals, which has been increasing, reaches a peak and then decreases, though the decrease in the number of infected individuals is surely induced by the decrease in the number of susceptible individuals. The cumulative number of infected individuals at the peak is one of the herd immunity thresholds. The herd immunity threshold depends on the value of the Potential infectious Capacity (pfc). For the case in which the initial population of the community is 1,000,000 and the initial number of infected individuals is 1, the latent period is 5 days and the recovery period is 14 days, when pfc is 1.0, the cumulative number of infected individuals reaches 466,620 (approximately 47% of the population) at the peak on the 87th, though the total number of infected individuals becomes 598,287 (approximately 60% of the population). When pfc is 2.0, the cumulative number of infected individuals reaches 714,026 (approximately 71% of the population) at the peak on the 50th, though the total number of infected individuals reaches 809,959 (approximately 81% of the population). Herd immunity could be achieved sooner than expected, but it surely is achieved only at the cost of so many infected individuals with so much death.
• For the flexible model used here, the symptomatic rate can be practically used as the isolation rate. The isolation rate depends on the characteristics of the virus and on the health conditions of infected individuals as the symptomatic rate does. However, sometimes, the number of isolated individuals is controlled by political and medical interventions for some reasons induced by the capacity of hospital care. Namely, in some circumstances, the isolation late and the symptomatic rate is changed by some political and medical interventions. When the symptomatic rate is set to 1, the number of newly infected individuals reaches 2,135 at the (first) peak on the 191st and 192nd and then decreases to 0 on the 326th, with a total number of infected individuals of 141,788. The infection duration, which ends when the infected individual disappears for the purpose of calculation, is 354 days. However, when the symptomatic rate is changed on the 201st from 1 to 0.8, the number of newly infected individuals has a second peak of 2,210 on the 228th and then decreases to 0 on the 397th, with a total number of infected individuals of 228,640, approximately 1.6 times larger than that of the case without any change in symptomatic rate. The infection duration was 439 days. When the symptomatic rate is changed from 1 to 0.8 on the 251st, the number of newly infected individuals also has a second peak of 88 on the 266th and then decreases to 0 on the 827th, with a total number of infected individuals of 154,454, approximately 1.1 times larger than that of the case without any change in the symptomatic rate. The infection duration is 1,029 days, indicating that the duration becomes extremely long. When the symptomatic rate is changed on the 300th from 1 to 0.8, the number of newly infected individuals’ decreases from the first peak of 2,135 to 3 on the 300th and further to 0 on the 784th, with a total number of infected individuals of 142,430. Although the infection duration becomes markedly longer, reaching 1,500 days, the total number of infected individuals only slightly increases. Therefore, for the same value of the symptomatic rate less than 1, the earlier the date of setting the symptomatic rate is, the larger the total number of infected individuals becomes. Notably, for the same setting date, the smaller the value of the symptomatic rate, the larger the total number of infected individuals becomes.
• However, when the symptomatic rate is reduced from 1 to 0.0 on 301st, meaning that any newly infected individuals are not isolated and are staying in the community on and after the 301st, the number of newly infected individuals decreases from 2,135 at the first peak to 3 on the 300th with a total number of infected individuals of 141,745, suggesting that the infection has almost subsided. Surely, the number of newly infected individuals decreases further to 2 for the period from the 305th to the 308th. After the bottom, however, the number of newly infected individuals rapidly increases to 7,238 at the second peak on the 413th and then decreases to 0 on the 534th, with a total number of infected individuals of 471,006, approximately 3.3 times larger than that of the case without any change in the symptomatic rate. The infection duration becomes as long as 573 days. The total number of infected individuals for the second term after the 301st is 329,261. It is approximately 2.3 times larger than that of the first term, 141,745. Thus, a large reduction in the symptomatic rate, meaning a large decrease in the number of isolated individuals and a large increase in the number of infected individuals staying in the community, must cause a serious spread of infection with a longer infection duration, even if the reduced symptomatic rate is set at a late time in the infection duration.
• Vaccination decreases not only the number of susceptible individuals but also the contact rate. Thus, vaccination is expected to reduce the number of infected individuals even for cases with a symptomatic rate less than 1. When the symptomatic rate is set to 0.8 and the vaccination rate is 0, meaning that the number of vaccinated individuals is 0, the number of individuals newly infected a day reaches 8,670 at the peak on the 125th and then decreases to 0 on the 217th. The total number of infected individuals was 336,096. It is approximately 2.4 times larger than that of the case with a symptomatic rate of 1 that is 141,788. The infection duration is 240 days. However, when the vaccination rate is set to 0.01 on and after the 101st, meaning that the vaccinated individuals are just 10,000 on and after the 101st, the number of newly infected individuals becomes 7,574 at the peak on the 125th and then decreases to 0 on the 223rd with a total number of infected individuals of 310,984, indicating 25,112 less than that of the case without any vaccination. The infection duration was 247 days. For other cases with different symptomatic rates, each case shows that the number of newly infected individuals and the total number of infected individuals are both markedly smaller than those of the case without any vaccinated individuals. Even though a symptomatic rate less than 1 causes a marked increase in the number of infected individuals, vaccination is considerably effective in decreasing the number of infected individuals, even for cases with a symptomatic rate less than 1.
• Individuals who are confirmed to be infected due to a positive test are isolated from the community. Thus, the PCR test causes changes in the population and in the number of isolated individuals, which is expected to induce a decrease in the number of infected individuals. When the symptomatic rate is set to 0.8 and the test is not performed, indicating that the tested individuals are 0, the number of newly infected individuals reaches 8,670 at the peak on the 125th and then decreases to 0 on the 217th. The total number of infected individuals becomes 336,096. As previously noted, it is approximately 2.4 times larger than that of the case without any change in the symptomatic rate, 141,788. The infection duration is 240 days. However, when the test with 1,000 tested individuals is started on and after the 101st, meaning that 1,000 individuals are tested every day on and after the 101st, the number of newly infected individuals becomes 7,534 at the peak on the 124th and then decreases to 0 on the 216th. The total number of infected individuals was 311,819, which was 24,277 less than that of the case with no test. The infection duration is 239 days. For other cases with different symptomatic rates, each case shows that the number of newly infected individuals and the total number of infected individuals are both markedly smaller than that of the case without any tested individuals. Therefore, it can be said that the PCR test and isolation treatment is considerably effective in decreasing the number of infected individuals even for cases with a symptomatic rate less than 1, even though a symptomatic rate less than 1 causes a marked increase in the number of infected individuals.
Acknowledgements
The author would like to thank Ms. Azumi Ohmori, MD., Assistant Director/Chief of Department of Obstetrics and Gynecology, Sakakibara Heart Institute, for the critical comments on the medical terms.
Funding
The author declares that no funds, grants, or other support were received during the preparation of this manuscript.
Conflict of interest
The author declares that he has no conflict of interest.
Data availability
Data will be made available on reasonable request.
References
- Ohmori H. A flexible compartment model for simulation specific to COVID-19.
- Centers for Disease Control and Prevention (CDC), Symptoms of COVID-19.
- Seladi-Schulman J. What to Know About Asymptomatic COVID-19. Healtline.2022.
- Nishiura H, Kobayashi T, Miyama T, Suzuki A, Jung SM, Hayashi K, et al. Estimation of the asymptomatic ratio of novel coronavirus infections (COVID-19). Int J Infect Dis. 2020;94:154-155.
[Google Scholar] [Crossref] [Pubmed]
- Moran-Gilad J. Whole genome sequencing (WGS) for food-borne pathogen surveillance and control–taking the pulse. Eurosurveillance. 2017;22(23):30547.
[Google Scholar] [Crossref] [Pubmed]
- Heneghan C, Brassey J, Jefferson T. COVID-19: What proportion are asymptomatic? CEBM.2020
- Oran DP, Topol EJ. Prevalence of asymptomatic SARS-CoV-2 infection: a narrative review. Annals of internal medicine. 2020 Sep 1;173(5):362-367.
[Google Scholar] [Crossref] [Pubmed]
- Alene M, Yismaw L, Assemie MA, Ketema DB, Mengist B, Kassie B, et al. Magnitude of asymptomatic COVID-19 cases throughout the course of infection: A systematic review and meta-analysis. PloS one. 2021;16(3):e0249090.
[Google Scholar] [Crossref] [Pubmed]
- Sah P, Fitzpatrick MC, Zimmer CF, Abdollahi E, Juden-Kelly L, Moghadas SM, et al. Asymptomatic SARS-CoV-2 infection: A systematic review and meta-analysis. Proc Natl Acad Sci. 2021;118(34):e2109229118.
[Google Scholar] [Crossref] [Pubmed]
- Gao W, Lv J, Pang Y, Li LM. Role of asymptomatic and pre-symptomatic infections in COVID-19 pandemic. BMJ. 2021;375.
[Google Scholar] [Crossref] [Pubmed]
- Ma Q, Liu J, Liu Q, Kang L, Liu R, Jing W, et al. Global percentage of asymptomatic SARS-CoV-2 infections among the tested population and individuals with confirmed COVID-19 diagnosis: a systematic review and meta-analysis. JAMA. 2021;4(12):e2137257.
[Google Scholar] [Crossref] [Pubmed]
- Ravindra K, Malik VS, Padhi BK, Goel S, Gupta M. Asymptomatic infection and transmission of COVID-19 among clusters: systematic review and meta-analysis. Public Health.2022;203:100-109.
[Google Scholar] [Crossref] [Pubmed]
- Shang W, Kang L, Cao G, Wang Y, Gao P, Liu J, et al. Percentage of asymptomatic infections among SARS-CoV-2 omicron variant-positive individuals: A systematic review and meta-analysis. Vaccines. 2022;10(7):1049.
[Google Scholar] [Crossref] [Pubmed]
- Wang Z, Wu P, Wang J, Lourenço J, Li B, Rader B, et al. Assessing the asymptomatic proportion of SARS-CoV-2 infection with age in China before mass vaccination. J Roy Soc Inter. 2022;19(195):20220498.
- Buitrago-Garcia D, Ipekci AM, Heron L, Imeri H, Araujo-Chaveron L, Arevalo-Rodriguez I, et al. Occurrence and transmission potential of asymptomatic and presymptomatic SARS-CoV-2 infections: update of a living systematic review and meta-analysis. PLoS Med. 2022;19(5):e1003987.
[Google Scholar] [Crossref] [Pubmed]
- Kermack WO, McKendrick AG. A contribution to the mathematical theory of epidemics. Proc Roy Soc. 1927; A115(772):700-721.
- Kermack WO, McKendrick AG. Contributions to the mathematical theory of epidemics-II. The problem of endemicity. Proc Roy Soc.1932;138A:55-83.
Citation: Ohmori H (2023) Effect of Symptomatic Rate on Spreading of COVID-19 Evaluated by a Flexible Compartment Model. J Clin Res Bioeth. 14:465.
Copyright: © 2023 Ohmori H. This is an open access article distributed under the terms of the Creative Commons Attribution License, which permits unrestricted use, distribution, and reproduction in any medium, provided the original author and source are credited.
