Indexed In
- Open J Gate
- Genamics JournalSeek
- Ulrich's Periodicals Directory
- RefSeek
- Directory of Research Journal Indexing (DRJI)
- Hamdard University
- EBSCO A-Z
- OCLC- WorldCat
- Proquest Summons
- Scholarsteer
- Publons
- Geneva Foundation for Medical Education and Research
- Euro Pub
- Google Scholar
Useful Links
Share This Page
Journal Flyer

Open Access Journals
- Agri and Aquaculture
- Biochemistry
- Bioinformatics & Systems Biology
- Business & Management
- Chemistry
- Clinical Sciences
- Engineering
- Food & Nutrition
- General Science
- Genetics & Molecular Biology
- Immunology & Microbiology
- Medical Sciences
- Neuroscience & Psychology
- Nursing & Health Care
- Pharmaceutical Sciences
Research Article - (2022) Volume 12, Issue 2
Effect of Incandescent and Fluorescence Bulb on Pentachlorophenol and Di-methoate on Spinach Leaf Surface
Antony Kinyua*, James Kamau Mbugua, Gabriel A Waswa and Joyce GN KithureReceived: 21-Jan-2022, Manuscript No. JMST-22-15514; Editor assigned: 24-Jan-2022, Pre QC No. JMST-22-15514(PQ); Reviewed: 07-Feb-2022, QC No. JMST-22-15514; Revised: 10-Feb-2022, Manuscript No. JMST-22-15514(R); Published: 17-Feb-2022, DOI: 10.35248/2155-9589-22.12.263
Abstract
Photo-degradation of pentachlorophenol and Di-methoate on spinach leaf surface by incandescent and a fluorescence bulb was investigated. The study involved, spraying the standard pesticide solutions on 5 cm-by-5 cm spinach leaf obtained from Negara market before exposing to 40 W, 60 W, 75 W and 100 W incandescent bulbs and 9 W, 11 W, 15 W and 20 W fluorescence tube for 10, 20, 30, 60 and 120 minutes. The remaining residues level after exposure was determined by Shimadzu UV-Visible spectrophotometer at 322 nm and 229 nm for Pentachlorophenol and Di-methoate respectively.
The results obtained indicate that the photo-degradation of pesticide residue depends on light intensity, temperature, pesticide molecular structure and time of exposure. The rate constant ranged from 0.0091 to 0.0116 for Di-methoate and 0.046 to 0.069 for pentachlorophenol. The rate of degradation was highest during the first 8 minutes of exposure platooning after 20 minutes. The degradation was highest in incandescent bulbs. This explained by the fact that these bulbs author emit both light and heat. It was highest in 100 W due to the high number of photons responsible for chemical reaction. The residues breakdown followed 1st order kinetics.
Keywords
Di-methoate; Kinetic; Rate constant; Pentachlorophenol; Photo-degradation
Introduction
Penta-Chloro-Phenol (PCP) is an organ chlorine insecticide while Di-methoate is an organophosphate insecticide used in insect control. This is because of their acute toxicity to insects and short persistence after application. After the pesticide is applied, only 0.1% of it reaches the target site while the rest ends up in environmental contamination [1]. Various processes such as absorption, breakdown, transfer and degradation affect pesticides in the environment. Transfer of pesticide refers to moving pesticides away from the targeted sites by leaching, spray drift, volatilization, run off, crop removal and absorption [2].
Once a pesticide is placed into the environment, several processes take place e.g. leaching process. Leaching helps the herbicides to reach into the root zone of the plant and this gives a farmer a better control of weeds. The Pesticides (chemical) that does not get or reach the target, would be very harmful to people and other organisms in the environment. Degradation of pesticide residues results from light, micro-organisms, chemical reactions and water. In some cases, photo-degradation by products is more harmful and toxic than the parent molecule. This may pose great danger to the public health. Environmentalist mainly specializes on the movement and removal of the parent molecule as compared to the by-products. The Kenyan government through the pesticide control board has banned several residues with an aim of protecting the environment. Therefore, there is an urgent need to study the fate of these residues to determine the extent of degradation when exposed to light and heat.
Methodology
All chemicals used were of analytical grade quality 99.8% Acetone and 99.8% Acetonitrile and obtained from 64271 Darmstadt, Germany and Aldrich respectively; Distilled water was double distilled into a glass bottle; 99.3% Pentachlorophenol, 99.8% Di-methoate, 1% Acetic Acid HPLC grade from Sigma Adrich. UV-Visible spectrophotometer (Shimadzu UV-Visible 1650 PC Shimadzu Scientific Instruments, 7102 River wood Drive Columbia, MD 21046 U.S.A), Analytical balance (Fischer scientific A-160); 1 cm quartz cuvette.
Stock solution preparation
100 ppm of the stock solution for pentachlorophenol and Di- methoate was prepared in analytical grade acetone (99.8%). Serial dilution method was used to prepare 2 ppm, 4 ppm, 6 ppm, 8 ppm, 10 ppm, 20 ppm, 40 ppm, 60 ppm, 80 ppm and 100 ppm solutions. The solutions were photo metrically scanned using Shimadzu UV- visible spectrophotometer model at 200 nm to 900 nm wavelength range to obtain the lambda maximum for each of the pesticide. A plot of absorbance versus concentration for each pesticide standard was made and further used in the degradation study to obtain the concentration decrease.
Photo-degradation study
Six sets of 5 cm spinach leaves were placed in a petri dish. 2 ml of 100 ppm of pentachlorophenol and Di-methoate were prepared in acetone was applied on the spinach leaf surface. Acetone was allowed to evaporate for 1 minute. The set was then exposed to sunlight, 40 W, 60 W, 75 W and 100 W incandescent bulbs, which were enclosed in a container to prevent light and heat loss. The sets were exposed for 10, 20, 30, 60 and 120 minutes. Temperature from each container was also recorded.
The above experimental procedures were repeated with fluorescence tubes of 9 W, 11 W, 15 W and 20 wattage bulbs in triplicate. The data obtained was analyzed using statistical software’s.
Kinetic study
In order to study the rate of degradation of pentachlorophenol and Di-methoate formulations plots of time versus natural logarithm of concentration were made to find the rate of degradation while the half-lives period (t-0.5) were calculated according to equation by Weerasinghee et al. [3].
t_0.5=ln2/k=0.693/k (1)
k=1/T_x .ln(a/b_x ) (2)
Where is k=rate constant, Tx=time in days, a=initial residue, bx=residue at time(x)
Results and Discussion
Standard solutions
From the photometrical scans of pentachlorophenol and Di- methoate, the absorption maxima (wavelength of maximum absorption) for pentachlorophenol and Di-methoate were found to be 322 nm and 229 nm, respectively. Further analyses for the residues determination were done at these wavelengths. When the photometric scan was done at this wavelength, the results obtained were used to plot the calibration curve. The calibration curves for each pesticide residue were constructed by plotting the absorbance versus concentration and are shown in the below Figures 1 and 2. The curve for both pesticides obeyed Beer’s law at concentrations 1.0 ppm to 10 ppm (low concentrations) this can be attributed to little chemical effects and physical effects as discussed in literature review. Beer’s Law is the relationship between concentration and absorbance [4-10].
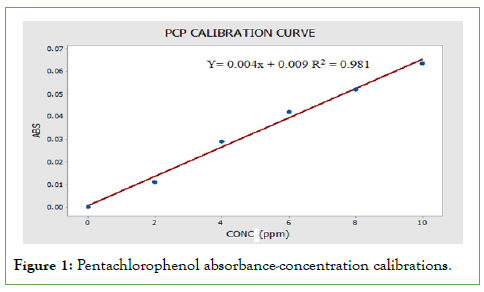
Figure 1: Pentachlorophenol absorbance-concentration calibrations.
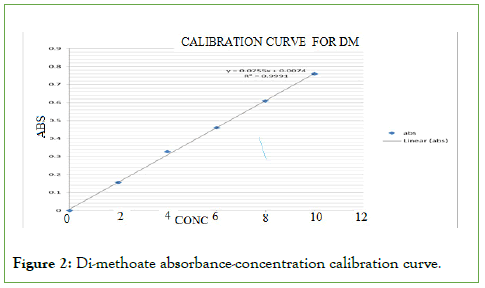
Figure 2: Di-methoate absorbance-concentration calibration curve.
For example, the Calculations of molar absorptivity for pentachlorophenol from the curves are:
A=εbc where A is absorbance, ε=molar absorptivity (1/mol cm), b=path wavelength in cm, and c=concentration (in mol/l).
So 0.01=ε × 1 × 1.8
ε=0.005
DM absorptivity (ε) is 0.14=ε × 1 × 2
ε=0.14/2, therefore ε=0.07
PCP degradation using incandescent bulbs
Photo-degradation of pentachlorophenol on spinach leaves surfaces was achieved by use of different wattage bulbs and sunlight. The incandescent bulbs had 40 W, 60 W, 75 W and 100 W. The results obtained for different radiation exposure are discussed below [11- 15].
When PCP was exposed to sunlight and incandescent bulbs of 40 W, 60 W, and 75 W, 100 wattages for 10, 20, 30, and 60 and 120 minutes, the amount of pesticide residue degraded with time was as shown in below Figure 3.
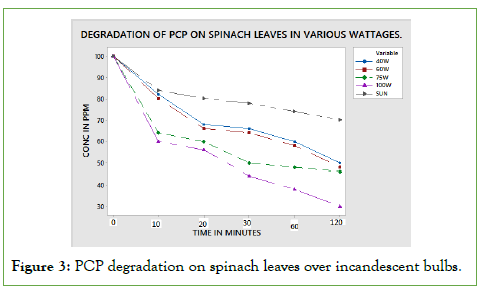
Figure 3: PCP degradation on spinach leaves over incandescent bulbs.
Pentachlorophenol (PCP) degradation using fluorescent tubes
The amount of PCP degraded after exposure of PCP on different intensities of fluorescent light is as shown in the below Figure 4.
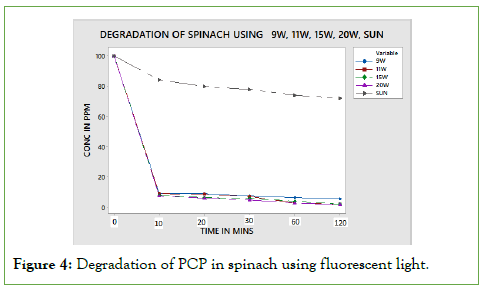
Figure 4: Degradation of PCP in spinach using fluorescent light.
From the results obtained above, PCP photo degradation was dependent on the surface of exposure, light intensity and time of exposure. This is in agreement with the Stark Einstein law. More photons are present in the 20 W tubes meaning higher chemical degradation. The spinach leaf surface is flat meaning that the amount of pesticide applied is fully exposed to radiation from the bulb. As a result, this translates to higher degradation. According to Figure 5, the curves level off from 10th minute to 120 minutes, which can be explained by the fact that the intensity difference between 9 W and 20 W is not significance to exhibit variation in degradation pattern.
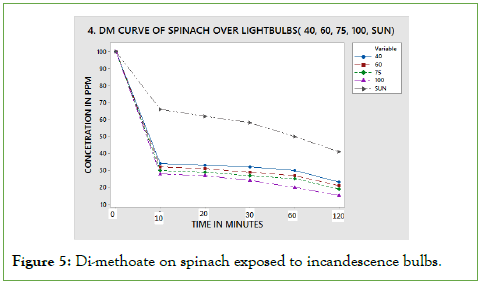
Figure 5: Di-methoate on spinach exposed to incandescence bulbs.
The half-life calculated for the PCP degradation on fluorescent light on different surfaces is shown in the below Table 1. According to the data obtained; the half-life is depended on time of exposure and the wattage reaching the pesticide surface.
| Exposure environment | 9 W | 11 W | 15 W | 20 W | Sunlight |
|---|---|---|---|---|---|
| 10 Minutes | |||||
| Spinach Leaf | 0.021425 | 0.021404 | 0.021437 | 0.021424 | 0.021077 |
| 20 Minutes | |||||
| Spinach Leaf | 0.021412 | 0.021401 | 0.021398 | 0.02394 | 0.021031 |
| 30 Minutes | |||||
| Spinach Leaf | 0.021409 | 0.021396 | 0.021393 | 0.02139 | 0.021027 |
| 60 Minute | |||||
| Spinach Leaf | 0.021405 | 0.021389 | 0.021383 | 0.021279 | 0.021011 |
| 120 Minutes | |||||
| Spinach Leaf | 0.021401 | 0.021379 | 0.021371 | 0.021355 | 0.021343 |
Table 1: Calculated half-life of PCP on spinach leaf using fluorescent tubes.
Di-Methoate (DM) degradation by incandescent bulb
When loam soil mixed with DM was subjected to incandescent bulbs and run in UV-VIS spectrophotometer for absorbance, the data obtained was plotted as shown in Figure 6, using Minitab software.
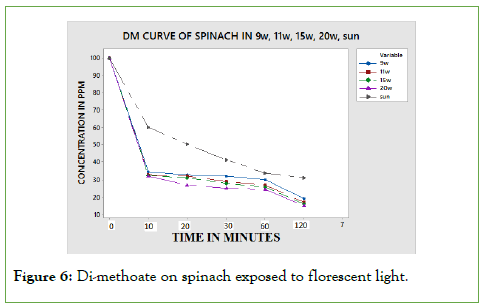
Figure 6: Di-methoate on spinach exposed to florescent light.
On spinach leaf surface, the degradation is the same for all the bulbs regardless of the exposure time. This is explained by the fact that the flat exposure surface experience light intensity similarly. This result in degradation of residues during the first few minutes of exposure is fast but slows down as molecules to be degraded are exhausted. On calculating the half-lives at different exposure time, the half-lives obtained are dependent on time of exposure, light intensity and on the type of surface used. The half-lives are tabulate in below Table 2.
| Exposure environment | 9 W | 11 W | 15 W | 20 W | Sunlight |
|---|---|---|---|---|---|
| 10 Minutes | |||||
| Spinach Leaf | 0.004462 | 0.004342 | 0.004283 | 0.00411 | 0.009423 |
| 20 Minutes | |||||
| Spinach Leaf | 0.008683 | 0.008449 | 0.00822 | 0.007353 | 0.013889 |
| 30 Minutes | |||||
| Spinach Leaf | 0.012673 | 0.11666 | 0.011029 | 0.010417 | 0.013719 |
| 60 Minutes | |||||
| Spinach Leaf | 0.023988 | 0.022058 | 0.020833 | 0.017945 | 0.013677 |
| 120 Minutes | |||||
| Spinach Leaf | 0.034781 | 0.032598 | 0.03152 | 0.030447 | 0.013648 |
Table 2: Calculated half-life of Di-methoate on Spinach leaf exposed to incandescent bulbs.
Di-methoate degradation by white light
Photo degradation of Di-methoate on spinach leaf surface results from the impact of light rather combined light intensity and temperature as observed in incandescent light. When Di-methoate pesticide was exposed to different applied power of fluorescence tubes, the results obtained are depicted in the below Figure 7A.
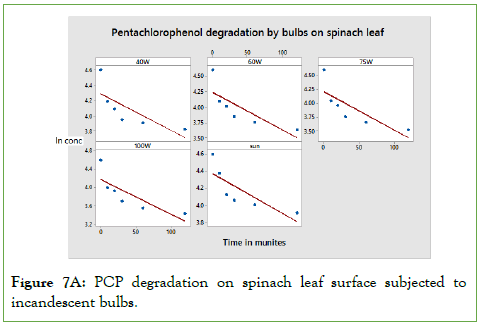
Figure 7A: PCP degradation on spinach leaf surface subjected to incandescent bulbs.
According to Figure 7B, above, the photo degradation of Di- methoate is in agreement with of Sterk Einstein law, which stipulates that for every photon absorbed by a molecule, it result in photochemical reaction. Photo degradation of Di-methoate is higher in 20 w exposures since the number of photons is higher compared to sunlight, 9 W, 11 W and 15 W. Just like in PCP, the amount degraded is highly dependent on time of exposure, surface and amount of light intensity.
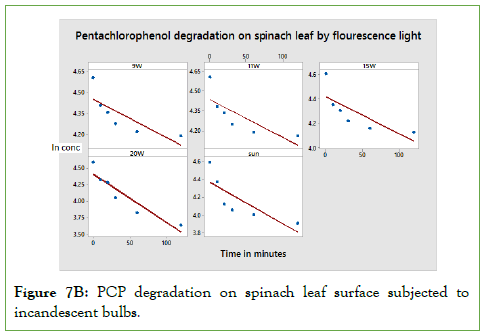
Figure 7B: PCP degradation on spinach leaf surface subjected to incandescent bulbs.
The calculated half-lives depend on the applied voltage of the fluorescent light and time of exposure among other factors like the molecular structure. The half-lives are tabulated in below Table 3.
| exposure environment | 9 W | 11 W | 15 W | 20 W | Sunlight |
|---|---|---|---|---|---|
| 10 Minutes | |||||
| Spinach Leaf | 0.004841 | 0.004711 | 0.004462 | 0.004342 | 0.002761 |
| 20 Minutes | |||||
| Spinach Leaf | 0.004799 | 0.004709 | 0.004456 | 0.004441 | 0.002431 |
| 30 Minutes | |||||
| Spinach Leaf | 0.004666 | 0.004602 | 0.004434 | 0.004437 | 0.002312 |
| 60 Minutes | |||||
| Spinach Leaf | 0.004408 | 0.004196 | 0.004144 | 0.004098 | 0.002307 |
| 120 Minutes | |||||
| Spinach Leaf | 0.004406 | 0.004033 | 0.004032 | 0.004047 | 0.004038s |
Table 3: Calculated half-life of Di-methoate on spinach leaf on white light.
Rate of degradation of PCP
The rate of degradation was determined using the equation [lnA]t/ [A]0=-kt. Plot of ln conc. versus wattage was plotted and the results below obtained were as shown below.
Rate of degradation of Di-methoate
The plots below were obtained when the rate of decay for DM was calculated.
The rates of degradation of the residues were dependent on: time of exposure, light intensity, particular molecular structure and temperature. As shown in Figures 8A to Figure 8B, the rate constant for PCP and Di-methoate is almost the same. The main difference is attributed to the effect of temperature. It’s important to remember that natural degradation of a given substance occurs with time, but this discussed here was accelerated by different exposure to sunlight, incandescent bulbs and fluorescent bulbs [16- 18]. Therefore, the accelerated lights are expected to be much faster than the natural decomposition. The rate of PCP and DM photo degradation can be obtained using equation [ln A]t/[A]0=-kt. The rate of degradation highly depends on the light intensity hitting the pesticide molecule surface and the surface of degradation. The rate of degradation was highest in DM spinach leaf samples. This can be explained by the fact that spinach leaf surface is well spread allowing maximum light reaching the surface [19,20].
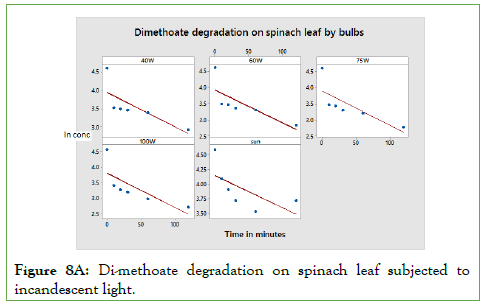
Figure 8A: Di-methoate degradation on spinach leaf subjected to incandescent light.
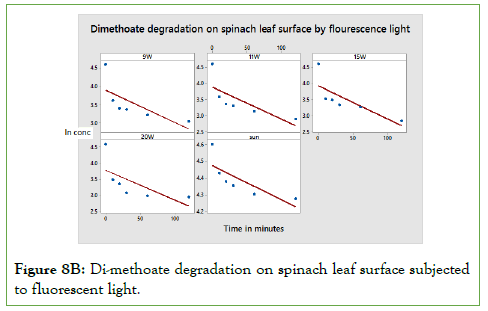
Figure 8B: Di-methoate degradation on spinach leaf surface subjected to fluorescent light.
Conclusion
Photo-degradation of residues on the surface of spinach leaf by different light intensity followed first order kinetic. The degradation rate was in sequence of 100 W>75 W>60 W>40 W>sun. The rate of degradation heavily relied on temperature, exposure time and light intensity. The half-life ranged from 0.069 to 0.141 days for spinach and 0.074-0.105 days for tomatoes. The rate of photo-degradation was heavily dependent on the molecular structure of the residue. Pesticide administration on vegetables and other fast growing crops should be done cautiously to avoid food contamination. The by- products of residues photo-degradation may be more hazardous than the parent molecules. This study therefore recommends thorough washing of food stuff prior to use and further research in analysis the structures of photo-degradation by-products. We finally recommend an Investigation of the pesticide residue level on vegetables especially spinach offered to the different market should be carried out. This is to determine the levels of residues and their different degradation products.
REFERENCES
- Ardley J. Pesticide’s consideration on environment concern. Agric Sci. 1999;(2).1-9.
- Casida JE, Gammon DW, Glickman AH, Lawrence LJ. Mechanism of selected action of pyrethroids. Annu Rev Pharmacol Toxicol. 1983;23:413-438.
- Weerasinghe CA, Mathews JM, Wrights RS, Wang RY. Aquatic photo-degradation of albendozole and its major metabolites, Reaction quantum yield, photolysis rate and half-life in the environment. J Agriculture Chem. 1992;40(8):1419-1421.
- Baker EA, Hunt GM, Stevens PJ. Studies of plant cuticle and spray droplet interactions: A fresh approach. Pestic Sci. 1983;14(6):645-658.
- Barcelo D, Durand G, De Bertrand N. Photo degradation of the organ phosphorus pesticides chlorpyrifos, fenamiphos and vamidothion in water. Toxicol Environ Chem. 1993;38(3-4):183-199.
- Lamp B. Lecture notes Chemistry 322. UV-Vis Techniques. Retrieved from Analytical technique-UV-VIS notes 2012.
- Cabras P, Spanedda L, Cabitza F, Cubeddu M, Martini MG, Brandolini V, et al. Pirimicarb and its metabolite residues in lettuce. Influence of cultural environment. J Agric Food Chem. 1990;38(3):879-882.
- FAO. Specifications and evaluation for agriculture pesticides. 2020.
- Floesser-Mueller H, Schwack W. Photochemistry of organ phosphorus insecticides. Rev Environ Contam Toxicol. 2001;172:129–228.
- Holmes MG, Keiller DR. Effects of pubescence and waxes on the reflectance of leaves in the ultraviolet and photosynthetic wavebands: A comparison of a range of species. Plant Cell Environ. 2002;25(1):85-93.
- Katagi T. Photo degradation of pesticide on plants and soils surfaces. Rev Environ Contam. 2004;182:1 -189.
- Lendzian KJ, Kerstiens G. Sorption and transport of gases and vapors in plant cuticles. Rev Environ Contam Toxicol. 1991;65-128.
- Mathew PT, August KT. Analytical methods for pesticides. India J Physiol Pharrnal. 1975;19: 213-217.
- Mbugua J, Mbui D, Kamau G. Investigation of rate of photo-degradation of chlorothalonil, lambda cyhalothrin, pentachlorophenol and chlropysis on tomato and spinach. Modern Chem Appl. 2017;5(1): 1-6.
- Miller GC, Hebert VR, Miller WW. Effect of sunlight on organic contaminants at the atmosphere–soil interface. Reactions and Movement of Organic Chemicals in Soils. 1989;22:99-110.
- Miller GC, Zepp RG. Extrapolating photolysis rates from the laboratory to the environment. Residue Rev. 1983;89-110.
- Ola MY, Shereen AA. The effect of heat, direct sunlight and UV rays on the stability of some chlropyrifos formulations with emphasis to this content of sultotep science. Nat Sci. 2010;8:229-233.
- Randhawa MA, Anjum FM, Ahmed A, Randhawa MS. Field incurred chlorpyrifos and 3, 5, 6-trichloro-2-pyridinol residues in fresh and processed vegetables. Food Chem. 2007;103(3):1016-1023.
- Li R, Zheng J, Wang R, Song Y, Chen Q, Yang X, et al. Biochemical degradation pathway of dimethoate by Paracoccus sp. Lgjj-3 isolated from treatment wastewater. Int Biodeterior Biodegr. 2010;64(1):51-57.
- Samsonov YN, Pokrovskii LM. Sensitized photodecompositions of high disperse pesticide chemicals exposed to sunlight and irradiation from halogen or mercury lamp. Atmos Environ. 2001;35(12):2133-2141.
Citation: Mbugua JK, Kinyua A, Kithure JGN, Waswa GA (2022) Effect of Incandescent and Fluorescence Bulb on Pentachlorophenol and Di- methoate on Spinach Leaf Surface. J Membrane Sci Techno. 12:263.
Copyright: © 2022 Kinyua A, et al. This is an open-access article distributed under the terms of the Creative Commons Attribution License, which permits unrestricted use, distribution, and reproduction in any medium, provided the original author and source are credited.
