


Indexed In
- Open J Gate
- Genamics JournalSeek
- Academic Keys
- JournalTOCs
- ResearchBible
- Ulrich's Periodicals Directory
- Access to Global Online Research in Agriculture (AGORA)
- Electronic Journals Library
- RefSeek
- Hamdard University
- EBSCO A-Z
- OCLC- WorldCat
- SWB online catalog
- Virtual Library of Biology (vifabio)
- Publons
- MIAR
- Geneva Foundation for Medical Education and Research
- Euro Pub
- Google Scholar
Useful Links
Share This Page
Journal Flyer

Open Access Journals
- Agri and Aquaculture
- Biochemistry
- Bioinformatics & Systems Biology
- Business & Management
- Chemistry
- Clinical Sciences
- Engineering
- Food & Nutrition
- General Science
- Genetics & Molecular Biology
- Immunology & Microbiology
- Medical Sciences
- Neuroscience & Psychology
- Nursing & Health Care
- Pharmaceutical Sciences
Short Communication - (2021) Volume 0, Issue 0
Dynamic Adjustment of SIR Model with the Social Permissiveness: An Actual Measure of the Infection Rate
Gerardo L. Febres*Received: 16-Aug-2021 Published: 06-Aug-2021, DOI: 10.35248/2155-9597.21.S11.003
Abstract
The COVID-19 pandemic has globally impacted the behavior of the social patterns affecting the disease’s contagiousness. This effect deviates the classical SIR model from reproducing the data of COVID-19 in most countries. This study incorporates a non-constant permissiveness function to the SIR model. The resulting model is computationally solved to obtain a likely permissiveness time-function. To solve the adjusted model, a technique based on a proportional-integral controller is applied. The resulting models are compared with previous results obtained by a manual iterative adjusting method.
Keywords
COVID-19; Infectious diseases; Infection rate; Reproduction rate
Introduction
Math modeling infectious diseases started about a century. The Kermack and Mckendrick model is the basis supporting more recent and detailed models [1]. Yet, the main idea of representing the infectious process as the result of the contact between infected and susceptible individuals remains fundamental in most math models capturing the dynamics of this process.
However, the SARS CoV-2 provoked modifications of the social activity and changes of mobility conduct at an unprecedented global level. These dynamic changes in the social behavior introduce waving patterns not accounted for in precedent math models. Therefore, the value of essential parameters used to adjust math models, as the Reproduction Rate (Ro), are clear candidates for a better measuring method. In a recent study Febres adjusted the classical Susceptible-Infected-Retired (SIR) model by introducing a time-function representing the social permissiveness [2]. An iterative process was devised to solve the model equations for the permissiveness function. The study showed this solving-iterating method, although very complex because it must work with several dimensions, does exist and is robust.
Materials and Methods
Models for the development of COVID-19 in 38 countries were adjusted by means of this manually driven iterative method. The resulting adjusted model is relevant since it provides the oscillatory nature of the process that is not present in the original SIR model and most of the more recent versions. Thus, while the classical SIR model cannot produce more than one oscillation, also named waves, the adjusted SIR model presented in explains the multiple waves we are experiencing as a consequence of the oscillatory behavior of the social distancing measures and the natural social behavior facing the development of events regarding the COVID-19 [2]. The term Permissiveness is given to the function-parameter representing the time-varying social contact
However, the manual control to achieve the convergence of the parameters of each country model is a clear drawback. Even though there are many ways that may improve the automatic tune method, it currently offers the results I put forward in this document.
The adjusted SIR model
The SIR model with the inclusion of the permissiveness timefunction e(t) and the vaccination campaign v(t) is as follows:
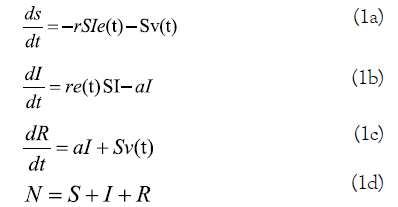
The terms S, I, R, r, a, and N are the susceptible, the infected, the retired, the infection rate, the removal rate, and the total population respectively. The vaccination time-function v(t) is presented for the sake of completeness. However, without diminishing the general applicability of the method, vaccination plan is left out of the solution presented by making v (t)=0.
To solve there are five functions to be determined: S(t), I(t), R(t), and e(t). Also the values of the constant parameters a and r must be established. The typical incubation time is about two weeks. Thus a removal time (1)⁄a implies the value a=0.07143.
This computation of S(t), I(t), R(t), and e(t) was performed using the complex system simulation platform MoNet, which allows for numerically and visually solving the set of equations (1a-1d) in many countries simultaneously [3]. Daily updated data is provided by the Center for Humanitarian Data [4]. The process starts by assuming a value of the transmission rate r. Then, equations (1a-1c) are numerically integrated, while the values of e(t) at each time are controlled to reduce the distance between the model and the data registered for each country. In order to keep stable this convergence problem, I implemented the idea of using a properly tuned proportional-integral controller. The implemented PI-controller sets each time value of function e(t) so that the difference between the infected curve I(t) and daily new cases reduces.
By using an outer iteration loop, the infection rate’s value r is progressively adjusted until the sum of the model-data difference for all countries modeled is minimal. The obtained value is r=491E-9.
Results and Discussion
This study is the first stage in developing a numerical method to estimate a quantitative assessment of the social mobility intensity. This study takes advantage of the prominent amount of data available, and the frequency at which it is updated, and the complex system simulation platform MoNet [3,4].
The use of PI controller as a mechanism to pursue the numerical solution of non-linear equation systems worked well for this study. The final solution function may be time-delayed to the actual and theoretical. A minor problem compared to the advantage of having an approximate shape of e (t).
Figure 1 compares the permissiveness curves e(t) manually obtained by Febres and their counterpart obtained by the automated method described here [2]. Figure 1 refers to three counties, but the results for all countries studied reflect similar results. The graphs on the right column of Figure 1 also show how the Model (1a-1d) and the automated method proposed can represent, not only the oscillations caused by the alternating values of the permissiveness, but also the minor scale oscillations present in the data of all countries. Note these minor scale oscillations were not captured by the manually adjusted model shown in the left column of Figure 1.

Figure 1: Comparing the manually adjusted models included in the study by Febres [2], and the models automatically adjusted by the methods introduced in the present study. The graphs on the left column show the manually adjusted models for Italy (top row), Japan (medium row) and Mexico (bottom row). The center and right columns show the models corresponding to the mentioned countries adjusted in the present study.
As suggested in the Introduction, computing the Basic Reproduction
Rates Ro should consider not only the properties of the virus
itself but also the characteristics of the media where the disease is
propagated; each country in the case of this study. Reproduction
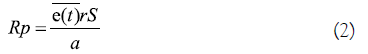
rate average values were estimated for the countries shown in Table 1. I use the symbol Rp to refer to the average reproduction
rate, thus differentiating these values from the reproduction rate
Ro, which refers to the initial stages of an epidemic. The average
reproduction rate is corrected by the average permissiveness  as
shown in Equation (2).
as
shown in Equation (2).
| Country | Susceptible S | Permissiveness |
Reproduction rate Rp |
|---|---|---|---|
| Japan | 1.26E+08 | 0.316 | 2.747 |
| Germany | 83783942 | 0.235 | 1.354 |
| Italy | 60461826 | 0.312 | 1.295 |
| Spain | 46754778 | 0.409 | 1.315 |
| Brazil | 2.13E+08 | 0.13 | 1.906 |
| Mexico | 1.29E+08 | 0.166 | 1.471 |
| USA | 3.31E+08 | 0.095 | 2.165 |
| Egypt | 1.02E+08 | 0.186 | 1.312 |
Table 1: Computed reproduction rates Rp considering the permissiveness for some countries.
For all cases the removal time is considered 14 days, leading the value a=0.07143, and the SARS CoV-2 infection rate r=491E-9.
The Model (1a-1d) is relevant since it provides the oscillatory nature of the process that is not present in the original SIR model and most of the more recent versions. Thus, while the classical SIR model cannot produce more than one oscillation, also named waves, the adjusted SIR model explains the multiple waves we are experiencing as a consequence of the oscillatory behavior of the social distancing measures and the natural social behavior facing the developments of events. Furthermore, the infectiousness should be seen as a non-constant property of the virus-social combination. I think this is crucial to properly apply to model and to understand the likely development of the COVID-19 pandemic.
Conclusion
The method for automatically tuning the adjusted SIR model to fit the historical data of infectious diseases opens up the possibilities for developing accurate and detailed models to improve our planning to fight against these diseases. Computing the reproduction rate Rp(t) as a function of time would offer the advantage of using the function’s value as an indicator of the epidemic’s tendency shortly and assessing the appropriateness of the social conduct besides the vaccination plans in any country.
REFERENCES
- Kermack WO, McKendrick AG. Contributions to the mathematical theory of epidemics—I. Bull Math Biol. 1991;53(1):33-55.
- Febres GL. Assessing the impact of social activity permissiveness on the COVID-19 infection curve of several countries. Arxiv. 2021.
- Febres GL. Basis to develop a platform for multiple-scale complex systems modeling and visualization: MoNet. Arxiv. 2019.
- Novel coronavirus (COVID-19) cases data. OCHA Services. 2020.
Citation: Febres GL (2021) Dynamic Adjustment of SIR Model with the Social Permissiveness: An Actual Measure of the Infection Rate. J Bacteriol Parasitol. S11: 003.
Copyright: © 2021 Febres GL. This is an open-access article distributed under the terms of the Creative Commons Attribution License, which permits unrestricted use, distribution, and reproduction in any medium, provided the original author and source are credited.