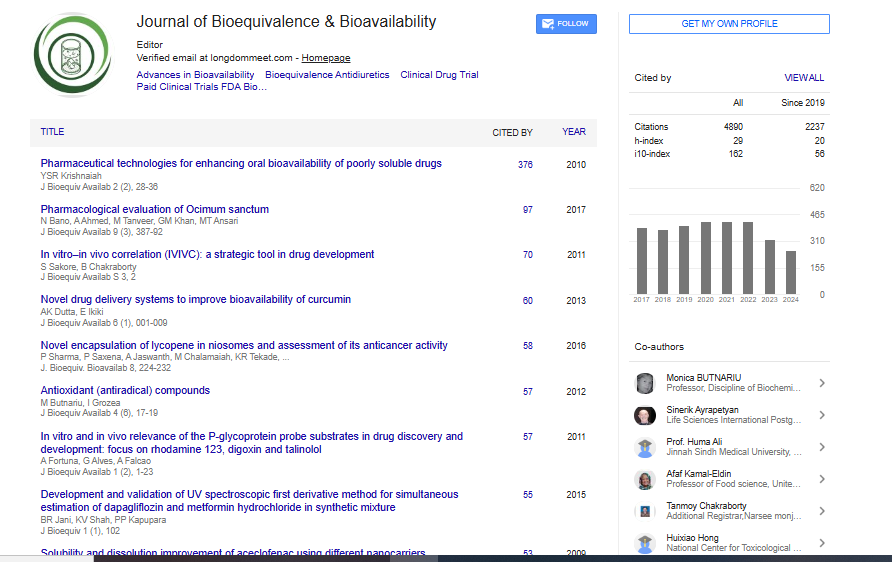


Indexed In
- Academic Journals Database
- Open J Gate
- Genamics JournalSeek
- Academic Keys
- JournalTOCs
- China National Knowledge Infrastructure (CNKI)
- CiteFactor
- Scimago
- Ulrich's Periodicals Directory
- Electronic Journals Library
- RefSeek
- Hamdard University
- EBSCO A-Z
- OCLC- WorldCat
- SWB online catalog
- Virtual Library of Biology (vifabio)
- Publons
- MIAR
- University Grants Commission
- Geneva Foundation for Medical Education and Research
- Euro Pub
- Google Scholar
Useful Links
Share This Page
Journal Flyer
Open Access Journals
- Agri and Aquaculture
- Biochemistry
- Bioinformatics & Systems Biology
- Business & Management
- Chemistry
- Clinical Sciences
- Engineering
- Food & Nutrition
- General Science
- Genetics & Molecular Biology
- Immunology & Microbiology
- Medical Sciences
- Neuroscience & Psychology
- Nursing & Health Care
- Pharmaceutical Sciences
Research Article - (2022) Volume 14, Issue 5
Determination of Fingolimod in Whole Blood by LC-MS/MS: Application to Bioequivalence Study
Ahmed Abu-Awwad1,2*, Tawfiq Arafate2, Basil Arafat3, Asaad Shahin4, Hadil Alotaibi5 and Mona Bustami62Jordan Center for Pharmaceutical Research, Amman, Jordan
3Department of Health, Education, Medicine and Social Care, Anglia Ruskin University, Chelmsford Campus, UK
4JOSWE Medical, Pharmaceutical Company in Amman, Amman, Jordan
5Department of Pharmaceutical Sciences, Pharmacy College, Princess Nourah Bint Abdulrahman University, Riyadh, Saudi Arabia
6Department of Pharmacy, University of Petra, Amman, Jordan
Received: 04-Apr-2022, Manuscript No. JBB-22-15980; Editor assigned: 08-Apr-2022, Pre QC No. JBB-22-15980 (PQ); Reviewed: 27-Apr-2022, QC No. JBB-22-15980; Revised: 09-May-2022, Manuscript No. JBB-22-15980 (R); Published: 17-May-2022, DOI: 10.35248/0975-0851.22.14.469
Abstract
A new bioanalytical liquid chromatography tandem mass spectrometric method has developed and validated for a clinical determination of fingolimod hydrochloride in whole blood. The method has applied in bioequivalence study following parallel open-label design, randomized single dose, and two treatments by healthy adult male subjects under fasting conditions. Fingolimod with labeled Internal Standard (IS; Fingolimod-D4) was extracted from human blood by liquid-liquid extraction and separated chromatographically from their matrix by Fortis UniverSil Cyano column. The established method was validated over calibration dynamic range of 12-1200 pg/ml for spiked blood. In single period, each subject of 42 healthy volunteer was received a single dose of 0.5 mg fingolimod hydrochloride capsule of either the test or reference product. The pharmacokinetic parameters of Cmax, AUC0–t and Tmax were calculated for fingolimod in blood of test product and compared with reference product. Fingolimod and IS have detected by a positive Multiple Reaction Monitoring (MRM) scan mode at mass filter of m/z 308.4 → 255.3 for fingolimod and 312.4 → 259.3 for IS. All validation results were within the acceptance criteria according to European guideline for bioanalytical methods. The current findings of AUC0-72, Cmax and Tmax for Gilenya® were bio-comparable to corresponding parameters derived from test product. The validated method was succefully applied in bioequivalence study to investigate figolimod 0.5 mg capsule from human whole blood following parallel periods design.
Keywords
Fingolimod; Bioequivalence; Parallel design; LC-MS/MS; Whole blood
Introduction
Fingolimod, a sphingosine 1-phosphate receptor modulator, chemically is a 2-amino-2-[2-(4-octylphenyl) ethyl] propane-1,3- diol (Figure 1). The immunomodulatory drug indicated for the oral treatment of relapsing-remitting forms of Multiple Sclerosis (MS), to include clinically isolated syndrome, and active secondary progressive disease in patients age of more than 10 years [1,2]. Pharmacokinetically, fingolimod post oral administration exhibits regardless to meals- a high bioavailability of 93% in slow absorption rate, where its maximum blood concentration (Cmax) reached at variable time (Tmax) between 12-16 hours [3,4]. Fingolimod elimination takes long time, its blood clearance rate about 6.3±2.3 L/h and half-life time (t½) from 6 to 9 days that occurred within long terminal phase.

Figure 1: Chemical structure of Fingolimod.
FDA guideline for drugs of long terminal phase (t½>24 h) recommends studies of single-dose crossover design must provide an adequate washout-period (5 times of the t½) to avoid the possible carryover of pre-administration levels in the subsequent dosing period, or to apply a parallel design instead, therefore, the washout period should last at least 5 times of the half-live of fingolimod (i.e., 30-45 days). Consequently, the bioequivalence studies for fingolimods went to crossover design that include drug disappearance period of not less than 6 weeks [5–9]. Herein, the objective of current study was to investigate the bioequivalence of fingolimod 0.5 mg capsule under fasting conditions following a parallel design and two stages written protocol, instead of long time washout period and to minimize the carryover risk of crossover design [10]. Furthermore, a new easy bioanalytical method has validated and applied in this study to quantify such challenging low dose of fingolimod from human whole blood, where few reported methods are including blood as a matrix and either not sensitive enough or costly with a long run time. Even the most recent report has a good sensitivity, but achieved through two extraction steps (protein precipitation followed by solid phase extraction) and not including blood extraction with long run time, while the current developed method has validated over sensitive enough LLOQ and achieved by single extraction step from blood matrix within short runtime (Figure 1) [11-15].
Materials and Methods
Chemicals and reagents
Fingolimod hydrochloride (purity=88.77%) was obtained from JOSWE medical (Amman, Jordan); Internal Standard (IS) Fingolimod-D4 hydrochloride (purity=81.83%) was obtained from TRC Inc. The blood blank samples were harvested from donors and collected in the clinical site. LC/MS-quality deionized water, methanol, acetonitrile, ammonium chloride and ethyl acetate were purchased from Fisher, Germany, and the other chemicals were all of analytical grade.
Instrumentation
The mass spectrometer was API 4000, Applied Biosystems, MDS SCIEX, coupled to LC from Agilent 1200 series. Computer system of windows 7 SP1, and Analyst 1.6.3 software for data management system.
LC conditions
The chromatographic conditions were consisted from mobile phase of 1.0 mM Ammonium chloride: methanol: acetonitrile (10:60:30%, v/v), pumped isocratically through column of Fortis UniverSil Cyano, (50 × 2.1) mm, 5 μm, at constant flow rate of 0.6 ml/min under fixed temperature of 40˚C for column oven and samples tray temperature fixed at 15˚C where the injection volume was 10 μl and total run time of 2.2 min.
Mass spectrometric conditions
The optimized mass spectrometric conditions for MRM were DP 50, EP 5.3, CE23.8 and CXP 16. The ion source conditions were curtain gas=12, CAD=gas 10, gas1=55, gas1=55, gas2=40, evaporation temperature=600˚C and the ion source voltage=5500 V under positive scan mode.
Standard solution
Fingolimod and IS master standard solutions were prepared in methanol, then the working standard solutions were diluted from master solution by 50% v/v methanol in water in order to prepare the serial solution which used for blood spiking of calibration samples.
Standard calibration curves and quality control samples
Standard calibrators and Quality Control Samples (QC) for fingolimod in human blood (analyte-free pooled blank) were prepared by spiking 50 μl of working solution into 450 μl of blood to prepare the calibrators of 12, 24, 50, 100, 200, 400, 800 and 1200 pg/ml, QC low 36, QC mid1 150, QC mid2 480 and QC high 960 pg/ml for fingolimod in blood.
The proposed dynamic range of the calibration curve was following the European and US FDA guidelines for bioequivalence studies and upon maximum concentration of 0.5 mg fingolimod in human blood [16-18]. The lowest concentration of calibrators (12 pg/ml) was considered as the Lower Limit Of Quantitation (LLOQ). The spiked QC samples were divided into aliquots and stored in deep freezer at −40˚C ± 5˚C until analysis with the subject’s samples at the same storage conditions. The applied calibration curve in validating method and routine analysis was consisted from a blank sample, zero concentration (spiked IS in blank) followed by eight calibrators including LLOQ.
Sample preparation
Fingolimod with IS was extracted from human blood samples by liquid-liquid extraction technique, where 1 ml of blood (spiked blank or subject’s samples) was pipetted into a previously labeled tube and 70 μl of IS (10 ng Fingolimod-D4/mL) was added, then vortexed for 10 sec, the extraction solvent (5.0 ml ethyl acetate) added and shacked for 3 min using a Vibrax Type VX-Z, VXR BasicVortexer (IKA-Werke GmbH & Co., Staufen, Germany) then centrifuged by Multitude Sigma1-15 (Sigma, Germany) for 5 min at 4400 rpm, and the separated two layers were frozen at -20°C, the supernatant was then decanted into a clean labeled evaporating glass tube for solvent evaporation by compressed air in water bath of 35°C inside of fume hood, the residue was then reconstituted with 170 μl of mobile phase and vortexed for 2 min, then 170 μl of the sample transferred into a glass flat bottom insert vial for analytical injection.
Bioanalytical method validations
The developed method for investigation of fingolimod in human blood was fully validated in concordance with the European and US FDA guidelines for bioanalytical methods validation [19,20]. The method was validated in terms of specificity, LLOQ, carryover, sensitivity, response linearity, accuracy, precision, dilution integrity, matrix effect, recovery and stability.
Specificity and carryover
Specificity of the method was confirmed by replicates analysis of blood blank from 6 different sources then interference was evaluated with comparison to LLOQ. Carryover effect was estimated in blank samples subsequently injected to higher concentration sample to ensure that used rinsing solution able to clean the injection needle. According to the guideline, interferences or carryover shouldn’t exceed 20% of the LLOQ and 5% for the IS.
Linearity, precision and accuracy
A linear response was obtained from the Fingolimod to IS peak area ratio versus its concentration over the dynamic range using 1/X weighted factor. The slopes and intercepts for representative analytical runs of Fingolimod were reported. The precision and accuracy of within run evaluation was estimated by analysis analytical sequence containing 6 replicates of LLOQ and each level of QC sample with calibration curve included zero and blank. Between-run linearity, precision and accuracy were estimated by analysis of three sets intra-run sequences in three different days, where each precession run was freshly prepared.
Recovery and matrix effect
The recovery of fingolimod by liquid-liquid extraction procedure was evaluated from peak area of fingolimod in extracted spiked samples for QC samples at low, Mid1, Mid2 and high with comparison to fingolimod peak area in unprocessed samples of spiking supernatant at corresponding QC samples with. Matrix Factor (MF) was investigated in 6 different lots of blood for fingolimod and IS, where the ratio of the peak areas in presence of matrix (prepared by spiking of fingolimod in extracted blank) to the peak area in absence of matrix (corresponding concentration of true fingolimod solution). IS normalized MF was also calculated by dividing the MF of fingolimod over the MF of IS. CV% for IS- normalized MF was applied on 6 lots of blood from QC low and QC high, and not to be exceeded 15%.
Stability
Stability of fingolimod in blood was evaluated upon triplicate analysis of low and high QC samples which are analyzed immediately after each applied stability factor of storage conditions to avoid overlaps of stability factors. All QC samples that representing stability factors were analyzed against a freshly spiked calibration curve, then compared (stability samples) to a freshly spiked corresponding QC samples, where the mean concentration at each level representing stability not to be exceeded ±15% of true concentration. Short term and long term validation were applied on both of stock solution and spiked blood, where stock solution and spiked samples were kept under room temperature for 22 h and 15 h, respectively to evaluate short term stability, and then further estimation was applied after 8 days (under 2˚C-8˚C) for stock solution and 16 days under -20˚C for spiked samples parallel with subject samples as long term storage test. Short term stability for spiked QC samples was also estimated under preparation till injection conditions, where dry extract samples were studied for 55 h, the reconstituted samples were studied for 15 h and further test was applied under auto sampler cooling conditions (5˚C) for 26 h. Freeze and thaw stability cycles for fingolimod in blood samples were studied over four freeze and thaw cycles including at least 12 h refreezing duration that separate thawing cycles at room temperature of 1 h.
Clinical application
This study was conducted in compliance with declaration of Helsinki according to GCP and GLP guidelines [21]. The protocol was approved by the local institutional review board. A written informed consent and consent form were obtained from all participant volunteers before proceeding study. This study was designed a parallel, open label, single period, randomized, two treatments of single oral dose, two stages, laboratory-blinded, bioequivalence study for 0.5 mg fingolimod capsule test product under fasting conditions against Gilenya® 0.5 mg Capsule manufactured by Novartis Pharma Stein AG, Stein, Switzerland. In first stage of current study, 42 healthy adult subjects were participated in clinical site of research center (Amman, Jordan), where full screening on subject’s health including real time PCR for Covid 19 was applied before and after study application for each participant volunteer. Screening examination regarding vital signs (blood pressure and heart rate), ECG was performed before dosing and every two hours for the first 8 hours after drug administration, at the end of hospitalization and at follow up examination. In early morning, each subject was received a single dose of either the test or reference drug, with about 240 ml ± 5 ml of water after overnight fasting. (2 ml × 8 ml) blood samples were collected pre- drug administration and a series of 17 × 7 ml blood samples were collected post drug administration at the following times: 0.5, 1, 2, 3, 6, 9, 11, 12, 13, 14, 15, 16, 18, 22, 24, 48 and 72 hours.
The blood samples were collected using a short intravenous catheter (cannula) during the study to avoid multiple skin punctures, where the blood samples were collected into tubes using K3EDTA as anticoagulation agent and stored under temperature of -20˚C till analysis. The frozen blood samples were transferred from the clinical site to the laboratories of Jordan Center for Pharmaceutical Research (JCPR), Amman-Jordan, for analysis.
The statistical analysis of Cmax and AUC0-72 comprised analysis of variance with sequence, subject (sequence), and product and period effects for all untransformed pharmacokinetic parameters and after a logarithmic transformation of the data. Point estimates and 90% confidence intervals for the mean ratios of pharmacokinetic parameters were calculated after a logarithmic transformation of the data for test product compared to reference product.
Results and Discussion
LC–MS/MS analysis
The optimized tandem MS’s parameters exhibited high quantitative detection efficiency, where the molecular ion for fingolimod was detected with its daughter fragment at m/z 308.4/255.3 and 312.4/259.3 for IS. The optimized chromatographic conditions were also efficient enough to separate fingolimod from blood matrix with a good quantitative peak within short runtime of two min as seen from figure 2, where fingolimod with IS eluted at 1.7 min (Figure 2).

Figure 2: Extracted MRM chromatogram for QC high spiked in human blood.
Specificity and carryover
The used extraction method from human blood was specific to quantitate fingolimod over IS, and no endogenous peaks observed through validation and routine analysis. Figure 3 shows a chromatogram for extracted blank blood sample that lacks to any noticeable peak with comparison to LLOQ peak that showed in chromatogram of Figure 4. Furthermore, carryover test exhibited an efficient washing system for injection port, where all injected subsequent blank samples to the high concentration were not containing any of fingolimod or IS residual peaks.

Figure 3: Extracted MRM chromatogram for Blank of human blood.

Figure 4: Extracted MRM chromatogram for LLOQ spiked in human blood.
Standard calibration curve and linearity
The peak area ratio of fingolimod to IS in human blood was linear over the selected dynamic range (12-1200 pg/ml). The reported validation results of linear response for specified concentration in table 1 indicated a reproducible calibration curve’s parameter for spiked fingolimod in human blood (Table 1).
| Calibrators (pg/ml) n=9 | 12 | 24 | 50 | 100 | 200 | 400 | 800 | 1200 | Slope | Intercept | R2 |
|---|---|---|---|---|---|---|---|---|---|---|---|
| Mean | 12.22 | 23.61 | 50.32 | 99.37 | 198.29 | 405.9 | 787.68 | 1208.61 | 0.0016 | 0.0017 | 0.9997 |
| Accuracy | 101.81 | 98.38 | 100.65 | 99.37 | 99.15 | 101.47 | 98.46 | 100.72 | - | - | - |
| SD | 0.47 | 0.5 | 0.85 | 2.14 | 2.97 | 4.9 | 7.67 | 10.7 | 0.00004 | - | 0.0002 |
| RSD (%) | 3.84 | 2.12 | 1.68 | 2.15 | 1.5 | 1.21 | 0.97 | 0.89 | 2.65 | - | 0.0203 |
Table 1: Parameters summery for 9 replicates analysis of calibration curve during valuation using linear (1/x) regression mode.
Within- and between-run sensitivity, accuracy and precision
The within- and between-run accuracy and precisions for analysis of fingolimod in blood (spiked QC including LLOQ) were all within the acceptance criteria (Table 2).
| 6 replicates analysis | QCLLOQ (12 pg/mL) | QCLow (36 pg/mL) | QCMid-1 (150 pg/mL) | QCMid-2 (480 pg/mL) | QCHigh (960 pg/mL) |
|---|---|---|---|---|---|
| Mean | 10.34 | 33.19 | 144.5 | 481.86 | 936.18 |
| Accuracy (%) | 86.15 | 92.19 | 96.33 | 100.39 | 97.52 |
| SD | 1.04 | 0.39 | 4.52 | 8.81 | 23.02 |
| RSD (%) | 10.02 | 1.16 | 3.13 | 1.83 | 2.46 |
| Run 2 in Day 2 | |||||
| Mean | 12.39 | 35.08 | 145.94 | 480.59 | 923.3 |
| Accuracy (%) | 103.3 | 97.43 | 97.29 | 100.12 | 96.18 |
| SD | 0.92 | 0.93 | 2.3418 | 8.7601 | 61.95 |
| RSD (%) | 7.42 | 2.66 | 1.6 | 1.82 | 6.71 |
| Run 3 in Day 3 | |||||
| Mean | 12.68 | 35.06 | 145.98 | 477.32 | 903.73 |
| Accuracy (%) | 105.63 | 97.38 | 97.32 | 99.44 | 94.14 |
| SD | 0.18 | 1.01 | 2.31 | 7.47 | 41.46 |
| RSD (%) | 1.38 | 2.89 | 1.58 | 1.56 | 4.59 |
| Between-run accuracy and precision | |||||
| Mean | 11.8 | 34.44 | 145.47 | 479.93 | 921.07 |
| Accuracy (%) | 98.36 | 95.67 | 96.98 | 99.98 | 95.94 |
| SD | 1.31 | 1.2 | 3.11 | 8.11 | 44.48 |
| RSD (%) | 11.12 | 3.47 | 2.14 | 1.69 | 4.83 |
Table 2: Within- and between-run accuracy and precision for 9 replicates analysis of QC including LLOQ spiked in human blood.
Recovery and matrix effect
Table 3 summarizes the absolute recover for fingolimod and IS that obtained by direct comparison for peak areas of extracted QC samples with unprocessed corresponding samples of which spiked post extraction from human blood (Table 3).
| Fingolimod absolute recovery | |||||||||
|---|---|---|---|---|---|---|---|---|---|
| Peak area (n=3) | QCLow | QCMid-1 | QCMid-2 | QCHigh | |||||
| Extracted | unprocessed | Extracted | unprocessed | Extracted | unprocessed | Extracted | unprocessed | ||
| Mean | 9582 | 19113 | 40884 | 73270 | 150472 | 286502 | 261219 | 490284 | |
| Recovery (%) | 50.13 | 55.8 | 52.52 | 53.28 | Recovery% | 50.13 | 55.8 | 52.52 | |
| Mean | 52.93 | ||||||||
| SD | 2.336 | ||||||||
| CV (%) | 4.41 | ||||||||
| Fingolimod-D4 (IS) absolute recovery | |||||||||
| Peak area (n=3) | QCLow | QCMid-1 | QCMid-2 | QCHigh | |||||
| Extracted | unprocessed | Extracted | unprocessed | Extracted | unprocessed | Extracted | unprocessed | ||
| Mean | 163879 | 335305 | 167303 | 293212 | 186362 | 355100 | 168458 | 312314 | |
| Recovery (%) | 48.87 | 57.06 | 52.48 | 53.94 | |||||
| Mean | 53.09 | ||||||||
| SD | 3.399 | ||||||||
| CV (%) | 6.4 | ||||||||
Table 3: Within- and between-run accuracy and precision for 9 replicates analysis of QC including LLOQ spiked in human blood.
The effect of extracted blood matrix on fingolimod and IS was examined through 6 different blood sources at both of QC low and high, and given by the mean of IS-normalized MF in Table 4.
| IS-Normalized MF | |||||||||||||||||
|---|---|---|---|---|---|---|---|---|---|---|---|---|---|---|---|---|---|
| Blood 1 | Blood 2 | Blood 3 | Blood 4 | Blood 5 | Blood 6 | Blood 7 | Mean | SD | RSD% | ||||||||
| QCLow | 1.11 | 1.2 | 1.15 | 1.17 | 1.19 | 1.15 | 1.17 | 1.16 | 0.03 | 2.6 | |||||||
| IS-Normalized MF | |||||||||||||||||
| QCHigh | 1.06 | 1.08 | 1.08 | 1.1 | 1.11 | 1.09 | 1.05 | 1.08 | 0.02 | 1.86 | |||||||
Table 4: IS-Normalized MF that derived from matrix effect on both of QC low and high.
Stability
Fingolimod stability was examined out- and within the blood matrix at short-and long term by using both of QC low and high. The summery of all stability sections are reported in table 5 including the corresponding stability condition (Table 5).
| Stability test | Result |
|---|---|
| Fingolimod stock solution stability at 2˚C -8˚C for 8 days | Between 101.94% and 102.11% |
| I.S stock solution stability at 2˚C -8˚C for 8 days | Between 97.93% and 98.06% |
| Fingolimod stock solution stability at R.T for 21:30 h:min | Between 99.78% and 100.23% |
| I.S stock solution stability R.T for 21:30 h:min | Between 99.77% and 100.30% |
| Fingolimod working solution stability at 2˚C -8˚C for 8 days | Between 97.62% and 101.72% |
| I.S working solution stability at 2˚C -8˚C for 8 days | Between 98.30% and 102.73% |
| Fingolimod working solution stability at R.T for 21:30 h:min | Between 99.31% and 99.57% |
| I.S working solution stability at R.T for 21:30 h:min | Between 100.35% and 100.69% |
| Short term stability at R.T for 15 hours & 40 min | Between 97.33% and 98.17% |
| 4th Cycle freeze-thaw stability | Between 90.84% and 93.99% |
| Dry extract stability at R.T for 55:00 h:min | Post extraction stability after 94.5 h between 93.55% and 95.42% for fingolimod and between 98.59% and 103.83% for Fingolimod_D4 |
| I.S Dry extract stability at room temperature for 55:00 h:min | |
| Injection phase stability at R.T for 12:48 h:min | |
| I.S Injection phase stability at R.T for 12:48 h:min | |
| Fingolimod auto sampler stability at 15˚C for 26:37 h:min | |
| I.S auto sampler stability at 15˚C for 26:37 h:min | |
| Fingolimod long term stability at -20˚C for 16 Days | Between 94.93% and 96.95% |
Table 5: Summary of stability validation for fingolimod.
Clinical application
During clinical application, there were no clinically relevant abnormalities at physical examination, and all findings were normal for all volunteers, and there were no safety concerns during the course of the study.
One subject out of 42 participant volunteers who was subject to receive the reference product- has drawn from the study after providing his last blood sample at 18 h post dosing, and his analytical data was excluded from pharmacokinetic (pk) considerations consequently. In first stage of current study, the analytical data that obtained from the participant volunteers were enough and satisfying all pk parameters that required for bioequivalence evaluations and no more evaluations were needed to apply the second stage.
The illustration of concentration-time profile for analysis of fingolimod in human blood post oral administration of 0.5 mg fingolimod capsule under fasting conditions is presented in figure 5 for participant volunteers treated either by test or reference product (Figure 5).

Figure 5: Concentration-time profile for 0.5mg fingolimod in human blood including standard deviation bars for participant volunteers post oral
administration of test or reference product.
In table 6, the statistical analysis of Cmax, AUC0-72 and Tmax were investigated for fingolimod test product and compared to reference product (Table 6).
| Pk parameter | Test | Reference | Ratio of geometric mean | 90% Confidence interval (%) | |
|---|---|---|---|---|---|
| Cmax (pg/ml) | Geometric mean | 328.85 | 322.99 | 101.8 | 90.74 – 114.22 |
| Arithmetic mean | 339.34 | 327.02 | |||
| (RSD%) | 25.41 | 15.51 | |||
| SD | 86.23 | 5.72 | |||
| n | 21 | 20 | |||
| AUC0-72 (h*pg/ml) | Geometric mean | 19043.87 | 19668.74 | 96.82 | 86.83 – 107.96 |
| Arithmetic mean | 19596 | 19875.1 | |||
| (RSD%) | 23.95 | 14.16 | |||
| SD | 4692.56 | 2814.45 | |||
| n | 21 | 20 | |||
| Tmax (h) | Median | 16 | 16 | - | |
| Arithmetic mean | 16.9 | 18.75 | |||
| (RSD%) | 23.13 | 56.76 | |||
| SD | 3.91 | 10.642 | |||
| n | 21 | 20 | |||
Table 6: The pk parameters of Cmax, AUC0-72 and Tmax derived for each of reference and test product post oral administration of 0.5 mg fingolimod capsule under fasting conditions.
The current findings of AUC0-72, Cmax and Tmax are in agreement with the corresponding reports belong pk investigation of 0.5 fingolimod capsule in human body [7].
Based on the derived pk parameters of results obtained from this study, the test product was bioequivalent to the reference product Gilenya® 0.5 mg capsule of Novartis Pharma Stein AG, Stein, Switzerland, after administration of one capsule that contains 0.5 mg fingolimod hydrochloride.
Conclusion
The described method for determination of fingolimod in human whole blood by tandem MS was successfully validated and used to estimate a clinical bioequivalence of 0.5 mg fingolimod hydrochloride on healthy adult male subjects under fasting conditions, following parallel open-label design, randomized single dose, two treatments. Post oral single dosing. The current findings of AUC0-72, Cmax and Tmax for Gilenya® (reference product) were bio-comparable to corresponding parameters derived from test product.
Acknowledgments
The authors would like to acknowledge Princess Nourah Bint Abdulrahman University (Saudi Arabia) for sponsering the scientific publication.
Statements and Declarations
Compliance with ethical standards
Informed Consent: The informed consent was signed and obtained from each participant volunteers.
Conflict of Interest
The authors declare that there is no conflict of interests.
REFERENCES
- Huwiler A, Zangemeister-Wittke U. The sphingosine 1-phosphate receptor modulator fingolimod as a therapeutic agent: Recent findings and new perspectives. Pharmacol Ther. 2018; 185: 34-49.
[Crossref], [Google Scholar], [PubMed]
- Luo C, Jian C, Liao Y, Huang Q, Wu Y, Liu X, et al. The role of microglia in multiple sclerosis. Neuropsychiatr Dis Treat. 2017; 26: 1661-1667.
[Google Scholar], [PubMed]
- David OJ, Kovarik JM, Schmouder RL. Clinical pharmacokinetics of fingolimod. Clin Pharmacokinet. 2012; 51(1): 15-28.
[Crossref], [Google Scholar], [PubMed]
- Bai P, Estes K. Office of clinical pharmacology review. trbsvof. 2008;1-40.
- CHMP. Withdrawal assessment report. Eur Med Agency. 2020.
- Drug F and, (FDA) A. Draft Guidance on Fingolimod. FDA. 2011.
- Tanguay M, Frohlich T, Drouin M, Beuerle G. A randomized, open-label study assessing the bioequivalence of two formulations of Fingolimod 0.5 mg in healthy subjects. AAPS Open. 2018; 4: 1-6.
[Crossref], [Google Scholar], [Indexing at]
- Hung NA, Costa FG, Hung CT, Rosenberg ME. Bioequivalence study of 2 capsule formulations of fingolimod 0.5 mg assessing both parent drug and active metabolite in New Zealand healthy subjects (Truncated Design). Clin Pharmacol Drug Dev. 2020; 9: 610-620.
[Crossref], [Google Scholar], [PubMed]
- Holmoy T, Torkildsen O, Zarnovicky S. Extensive Multiple Sclerosis Reactivation after Switching from Fingolimod to Rituximab. Case Rep Neurol Med. 2018; 2018: 5190794.
[Crossref], [Google Scholar], [PubMed]
- Chandani R, He J, Biopharma FT. An effective approach to assess bioequivalence of fingolimod in normal healthy volunteers using 0.5 mg study dose. Am Assoc Pharm Sci impact factor. 2016;1030.
- Ferreirós N, Labocha S, Schroder M, Radeke HH, Geisslinger G. LC-MS/MS determination of FTY720 and FTY720-phosphate in murine intracellular compartments and human plasma. J Chromatogr B Anal Technol Biomed Life Sci. 2012; 887-888: 122-7.
[Crossref], [Google Scholar], [PubMed]
- Budde K, Schmouder RL, Brunkhorst R, Nashan B, Lucker PW, Mayer T, et al. First human trial of FTY720, a novel immunomodulator, in stable renal transplant patients. J Am Soc Nephrol. 2002; 13: 1073-83.
[Crossref], [Google Scholar], [PubMed]
- Suneetha A, Raja Rajeswari K. A high throughput flow gradient LC-MS/MS method for simultaneous determination of fingolimod, fampridine and prednisone in rat plasma, application to in vivo perfusion study. J Pharm Biomed Anal. 2016; 120: 10-8.
[Crossref], [Google Scholar], [PubMed]
- David OJ, Berwick A, Pezous N, Lang M, Tiel-Wilck K, Ziemssen T, et al. Determination of Seminal Concentration of Fingolimod and Fingolimod-Phosphate in Multiple Sclerosis Patients Receiving Chronic Treatment With Fingolimod. Clin Pharmacol Drug Dev. 2018; 7: 217-21.
[Crossref], [Google Scholar], [PubMed]
- Gopinath R, Narenderan ST, Kumar M, Babu B. A sensitive liquid chromatography-tandem mass spectrometry method for quantitative bioanalysis of fingolimod in human blood: Application to pharmacokinetic study. Biomed Chromatogr. 2020; 34.
[Crossref], [Google Scholar], [PubMed]
- European Medicines Agency. Guideline on bioanalytical method validation. Reference number EMEA/CHMP/EWP/192217/2009. 2012.
- FDA C, Services USD of H and H, FDA F and DA, Food and Drug Administration, Administration F and D. Guidance for Industry: Bioanalytical Method Validation. Food Drug Adm Cent Drug Eval Res (CDER), Cent Vet Med. 2001.
- Novartis Europharm Ltd. Overview of comments received on “Fingolimod capsules 0.25 and 0.5 product-specific bioequivalence guidance” (EMA/CHMP/154812/2016). EMA/CHMP. 2016; 44.
- Products C for HM. ICH guideline M10 on bioanalytical method validation. In: EMA/CHMP/ICH. 2019.
- Food and Drug Administration. Bioanalytical method validation guidance. Biopharmaceutics. 2018; 1043: 25.
- Declaration of Helsinki 2013. Declaration of Helsinki, ethical principles for scientific requirements and research protocols. World Med Assoc. 2013; 29-32.
Citation: Awwad AA, Arafate T, Arafat B, Shahin A, Alotaibi H, Bustami M (2022) Determination of Fingolimod in Whole Blood by LC-MS/MS: Application to Bioequivalence Study. J Bioequiv Availab. 14:469.
Copyright: © 2022 Awwad AA, et al. This is an open-access article distributed under the terms of the Creative Commons Attribution License, which permits unrestricted use, distribution, and reproduction in any medium, provided the original author and source are credited.