Indexed In
- Open J Gate
- Genamics JournalSeek
- JournalTOCs
- RefSeek
- Hamdard University
- EBSCO A-Z
- OCLC- WorldCat
- Publons
- Geneva Foundation for Medical Education and Research
Useful Links
Share This Page
Journal Flyer
Open Access Journals
- Agri and Aquaculture
- Biochemistry
- Bioinformatics & Systems Biology
- Business & Management
- Chemistry
- Clinical Sciences
- Engineering
- Food & Nutrition
- General Science
- Genetics & Molecular Biology
- Immunology & Microbiology
- Medical Sciences
- Neuroscience & Psychology
- Nursing & Health Care
- Pharmaceutical Sciences
Research Article - (2019) Volume 8, Issue 2
Cross-Cultural Adaptation of English Version of Vertigo Symptom Scale in Punjabi
Hardeep Kaur*, Shanu Vohra and Rajneet Kaur SahniReceived: 14-Aug-2019 Published: 20-Sep-2019
Abstract
Introduction: The Vertigo Symptom Scale mainly focuses on symptoms of vestibular disorders, that are anxiety and autonomic symptoms. Till now valid and culturally adapted Punjabi version of Vertigo Symptom Scale has not been produced yet, this study will describe the translation of the original 34-item version of VSS into Punjabi language and its Psychometric analysis in individuals with Benign Paroxysmal Positional Vertigo. The Cross-Cultural adaptation of a health status self-administered questionnaires for use in a new region, culture or language requires a distinctive methodology in order to reach equivalence between the original source and target languages. The adaptation of psychological scale is a complex task that requires orderly planning regarding its content maintenance, psychometric properties, and general validity for the intended population.
Methods: The study has been split into two parts. The English version of Vertigo Symptom Scale will be translated into Punjabi language following guidelines given by of Beaton. In the second phase the translated Vertigo Symptom Scale will be then tested for its reliability in persons with Benign Paroxysmal Positional Vertigo.
Results: Test retest reliability and internal consistency was calculated to check internal consistency Cronbach’s alpha, Split-Half (odd-even) correlation and Spearman-Brown Prophecy were calculated from the reading taken on Punjabi Vertigo Symptom Scale twice after the 48 hour. Calculated readings of Cronbach’s alpha are 0.998, Split- Half (odd even) correlation is 0.996, Spearman-Brown Prophecy is 0.997. Test retest intra-rater reliability calculated for Punjabi Vertigo Symptom Scale in group A is 0.998 (95% CI: 0.996-0.998).
Conclusion: The translated version of Vertigo Symptom Scale has been demonstrated to be reliable, valid, acceptable and simple to understand by the patients. Data analysis show satisfactory high internal consistency and also the translated version was able to differentiate population with dizziness and without dizziness.
Keywords
Cross-cultural adaptation; Translation; Vertigo Symptom Scale; Psychometric analysis
Introduction
Vertigo Symptom Scale is a widely used measure of dizziness and vertigo. Basically the scale was developed for use in rehabilitation of patient with vestibular disorders and other balance disorders. The VSS deals with primary and secondary symptoms of vestibular disorders, including anxiety and autonomic symptoms. This scale measures the frequency of symptoms using a Likert-like scale. Responses are rated between 0 (never) to 5 (more than once a week) for all symptoms associated with vestibular disorders vertigo for the past one year, or since the attack. The majority of the questions related to the autonomic symptom in this questionnaire are more related to vertigo than the other subtypes of dizziness. Autonomic symptoms such as nausea and vomiting are the typical features of peripheral vestibular disorders [1].
According to Yardley Vertigo Symptom Scale (VSS) is a disease specific questionnaire used widely in clinical settings. Firstly VSS was conducted in English and then has been translated into seven other languages: Dutch, French, German, Spanish, Swedish, Turkish and Malay. It has been accepted as a good subjective tool to determine the severity of balance disorders [2]. Their aim was to determine whether a self-report measure of vertigo severity could be developed that was uncontaminated by symptomatology caused by anxiety, and therefore, which could be used, in preference to vestibular test results, to examine the relative influence of vertigo and anxiety on reported handicap and distress [3]. Vertigo symptom scale has two subscales that are vertigo and somatic anxiety scales which are able to differentiate between the symptomatic and healthy persons as defined by Guerraz [4].
Fukuhara et al. describes that the term “cultural adaptation” is used to enclose a process which looks at both language (translation) and cultural adaptation issues in the process of preparing a questionnaire for use in another context. The Cross-cultural adaptation of a health status self-administered questionnaire for use in a new region, culture and language requires a distinctive methodology in order to reach equivalence between the original source and target languages [5].
Wiesinger et al. discussed that with the increase in the number of multi-national and multi-cultural research projects the need to adapt health status measures for use in other than the source language has also grown rapidly. Mainly questionnaires were flourished in English speaking countries but even within these countries, researchers must consider migratory natives in studies of health especially when their exclusion could lead to a systematic bias in studies of health care utilization or quality of life [6].
Procedure
The study was divided into two stages i.e., Translation of English version of Vertigo Symptom Scale into Punjabi language and psychometric analysis of Punjabi Vertigo Symptom Scale in population suffering from stroke. Firstly, permission was taken from the author of the scale for using and translating English version of Vertigo Symptom Scale into Punjabi language and after taking their permission the translation phase was started.
In this phase the English version of the Vertigo Symptom Scale was translated into Punjabi language according to guidelines given by the Beaton [7]. In the second phase the translated Vertigo Symptom Scale was then tested for its validity and reliability properties in individuals with benign paroxysmal positional vertigo.
Phase 1: Translation of English version of Vertigo Symptom Scale in Punjabi language
Stage I: Initial translation
The first stage was the forward translation of English version of vertigo symptom scale in Punjabi language. Two forward translations were made of the instrument from the English language (source language) to the Punjabi language (target language). Poorer wording choices was identified and resolved in a discussion between the translators. Bilingual translators whose mother tongue was the Punjabi language produced the two independent translations. The two translators were of different backgrounds.
Translator 1: This translator was aware of the concepts being examined in the questionnaire being translated and was from medical background. Appendix of informed consent of the translator was taken. This translator gave the first Punjabi translation (T1) of the English version of Vertigo Symptom Scale.
Translator 2: The second translator was not be aware or informed of the concepts and was having no medical or clinical background. This type of translator was called a naive translator. This translator gave the second translation (T2) of the English version of Vertigo Symptom Scale.
Stage II: Synthesis of the translations
Working from the original English version of Vertigo Symptom Scale as well as the first translator’s (T1) and the second translator’s (T2) versions, a synthesis of these translations was first conducted that produced one common translation T-12 (Appendix I).
Stage III: Back Translation (BT)
Working from the T-12 version of the scale and totally blind to the original version, another translator then translated the questionnaire back into the English language. This was a process of validity checking to make sure that the translated version reflected the same item content as the English versions. Back translation was only one type of validity check. These back-translations BT1 and BT2 were done by persons with the English as their first language. The two translators were not be aware or informed of the concepts explored, and were without medical background.
Stage IV: Expert Committee
According to guidelines [7] the composition of expert committee comprised of methodologist, health professionals, language professionals and the forward and back translators. The original developers of the questionnaire were in close contact with the expert committee during this part of the process. The expert committee consolidated all the versions of the questionnaire and developed the pre final version of the questionnaire for field testing. The committee reviewed all the translations and reached a consensus on certain discrepancy. The material at the disposal of the committee included the original questionnaire, and each translation (T1, T2, T12, BT1 and BT2) together with corresponding written reports. Decisions were made by this committee to achieve equivalence between the English and Punjabi version in four areas that are Semantic Equivalence, Idiomatic Equivalence, and Experiential Equivalence a Conceptual Equivalence.
Stage V: Test of the prefinal version
The final stage of adaptation process was the pre-test. This field test of the new questionnaire was done with the pre-final version in individuals from the Punjabi setting. 10 individuals with benign paroxysmal positional vertigo were tested. Each individual completed the questionnaire, and interviewed to probe about what he or she thought were meant by each questionnaire item and the chosen response. Both the meaning of the items and responses were explored.
Phase 2: Psychometric analysis of Punjabi version of Vertigo Symptom Scale
The data was assorted for psychometric analysis. Subjects suffering from benign paroxysmal positional vertigo were assessed using the Punjabi Vertigo Symptom Scale. According to inclusion and exclusion criteria, 100 subjects were selected with benign paroxysmal positional vertigo and 50 participants with no history of vertigo or dizziness. All the subjects were informed about the study and their consent was taken.
The test retest reliability was measured by intra-rater correlation coefficient and Cronbach’s alpha, Split-Half (Odd-even) correlation and Spearman-Brown Prophecy were calculated to check internal consistency. To calculate test retest reliability readings with Punjabi Vertigo Symptom Scale were scored and calculated twice with time gap 24 hours by the same therapist as described by Kamalvand [8].
Results
Translation
After forward and backward translation and after a consensus meeting, the translated scale was formed.
Psychometric analysis
Test retest reliability and internal consistency was calculated in Group A: In order to evaluate internal consistency Cronbach’s alpha, Split-Half (odd-even) correlation and Spearman- Brown Prophecy were calculated from the reading taken on Punjabi Vertigo Symptom Scale twice after the 48 hour. Calculated readings of Cronbach’s alpha are 0.842 and 0.837, Split-Half (odd even) correlation are 0.712 and 0.708 and Spearman- Brown Prophecy are 0.832 and 0.829. Test retest intra-rater reliability calculated for Punjabi Vertigo Symptom Scale in group A is 0.998 (95%CI: 0.996-0.998).
Discriminant validity was checked in group B by Unpaired 't' test. The value of Unpaired 't' test is 34.929, which show significant result for validity. Data of Group A was meaningfully assorted by calculations of Score 1 and Score 2 i.e., test and retest values. Intraclass correlation Co-efficient was calculated. Table 1 denoted the result of Intraclass Correlation Coefficient that was done to check the test retest reliability. The result shows average measures of Intra-class Correlation Coefficient equals to 0.9979 at 95% CI (0.996 to 0.998) (Figure 1).
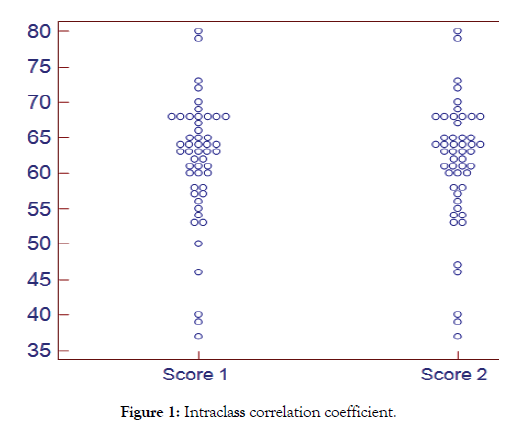
Figure 1: Intraclass correlation coefficient
| Number of subjects (n) | 50 | |
|---|---|---|
| Number of raters (k) | 2 | |
| Model | The same raters for all subjects. Two-way model. | |
| Type | Consistency | |
| Measurements | Score1 | |
| Score 2 | ||
| Intraclass Correlationa | 95% Confidence Interval | |
| Single measuresb | 0.9958 | 0.9926 to 0.9976 |
| Average measuresc | 0.9979 | 0.9963 to 0.9988 |
Table 1: Intraclass correlation coefficient of score 1 and score 2.
Table 2 and Figure 2 denotes the result of Pearson’s correlation done to assess the validity of Score 1 and Score 2 in Group 2. The results shows Mean ± SD of score 1 was 61.64 ± 8.727 and Mean ± SD for score 2 was 61.38 ± 8.806. This showed a high degree of positive correlation as shown in Figure 2. Table 3 shows the Discriminant validity through comparison between groups of VSS (Healthy) and VSS (Patients) using unpaired ‘t’ test where Mean ± SD of VSS (Healthy) was 8.80 ± 4.969 and Mean ± SD for VSS (Patients) was 58.58 ± 8.767. The ‘t’ value obtained was 34.929, which was statistically significant of the level of P<0.05 (Figure 3).
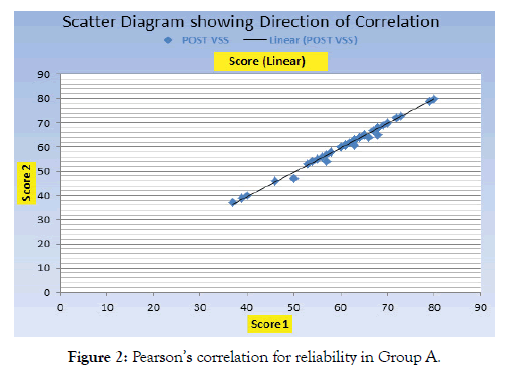
Figure 2: Pearson’s correlation for reliability in Group A.
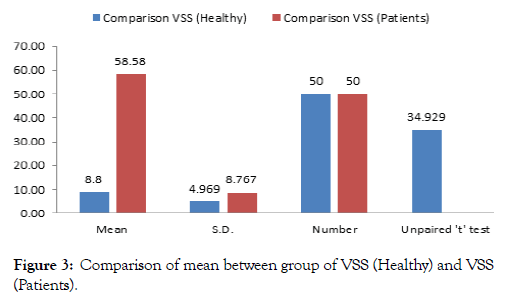
Figure 3: Comparison of mean between group of VSS (Healthy) and VSS (Patients).
Pearson's Correlation |
Group A | |
|---|---|---|
| Score 1 | Score 2 | |
| Mean | 61.64 | 61.38 |
| SD | 8.727 | 8.806 |
| N | 50 | |
| Correlation (r) | 0.996 | |
Table 2: Pearson’s correlation for reliability in Group A.
Unpaired 't' test |
Comparison | |
|---|---|---|
| VSS (Healthy) | VSS (Patients) | |
| Mean | 8.8 | 58.58 |
| S.D. | 4.969 | 8.767 |
| Number | 50 | 50 |
| Unpaired 't' test | 34.929 | |
Table 3: Unpaired 't' test for validity in Group B.
Discussion
The study was divided into phases. First the translation process was completed and then the translated version was tested for its psychometric analysis. Translation and cross cultural adaptation was performed using internationally recognized methods and under the guidance of an experts committee that manage the original meaning of the items as described by Wild [9]. So in this study the original vertigo symptom scale was translated into Punjabi language by following the guidelines given by Beaton and the psychometric analysis was done to make it culturally adapt for Punjabi population. Punjabi Vertigo Symptom Scale was evaluated for reliability and validity by applying intraclass correlation coefficient, Pearson’s correlation coefficient and paired test [10].
Test-retest intra-rater reliability has been calculated for Punjabi Vertigo Symptom Scale and resulted equals to 0.998. The test and retest values for internal consistency of Punjabi Vertigo Symptom Scale was equal to 0.998, the value of Pearson’s correlation Coefficient was equal to 0.996 and paired ‘t’ test value was 34.037 as shown in Table 1. The results showed the excellent reliability and validity of Punjabi Vertigo Symptom scale. Use of statistical tools in this study was in accordance to the following studies.
The aim of this study was to translate the autism treatment evaluation checklist into Persian version, Cross- culturally adapt it and to assess its psychometric properties. The internal consistency of the scale was also determined by using Cronbach’s alpha that was equal to 0.86-0.93 [11].
The aim of this study was to translate the Activities-specific Balance Confidence scale into a Hindi version (ABC-H), Cross-culturally adapt it and to assess its psychometric properties. The internal consistency of the 16-item Activities-Specific Balance Confidence Scale ABC-H scale was also determined using Cronbach’s alpha that was equal to 0.97-0.88.
George provided the following rules of thumb for the interpretation of Cronbach’s α coefficient value: ≥ 0.9, excellent; ≥ 0.8, good; ≥ 0.7, acceptable; ≥ 0.6, questionable; ≥ 0.5, poor; and ≤ 0.5, unacceptable [12]. Test-retest reliability was established using the intra-class correlation coefficient that came out to be 0.97 and indicated excellent stability and repeatability of the scale items. Pearson’s correlation coefficient was also used to evaluate the relationship between initial and final total scores of the ABC-H scale as described by Fowler [13].
Leplege remind researchers to be aware that item-level translations can often work on the assumption that the same items, once translated, will be meaningful reflections of health in a new culture. The authors’ method allows for that adaptability, but it is useful to remember that attention must be paid not only to item equivalence, but to the others described as well. The authors’ best understanding to date is that a poor translation process may lead to an instrument that is not equivalent [14].
Eremenco et al. explained another aspect concerning the validation of psychological instruments concerns the adaption of the measure for use in Cross-cultural studies. From this perspective, some authors use the concept of equivalence that refers not only to the qualitative aspects of the adapted instrument but also to the non-biased measurements between the adapted instrument and its original source. In this way, all the results of Cross-cultural studies reflect only the actual differences or similarities between groups and are not the product of adaptation flaws [15].
Cuesta-Vargas A confirms Cross-cultural adaptation, reliability and validity of the Spanish version of the upper limb functional index. Internal consistency of the scale items was also determined from Cronbach's α coefficients as calculated at an anticipated value range of 0.80-0.95 [16].
Spanish Cross-Cultural Adaptation and Validation of the National Institutes of Health Stroke Scale study done by Domínguez also Inter-rater reliability was excellent between the 2 examiners, with κ ranging from 0.77 to 0.99 for the 15 items on the test. The interrater correlation coefficient was very high (0.991; 95%CI, 0.987- 0.994). It was hoped that this instrument will be of practical use to Spanish-speaking physicians examining Spanish-speaking patients with stroke, as well as to researchers who study the effects of stroke on Spanish-speaking populations [17].
According to Kline the most important index of test reliability is the Cronbach’s alpha [18]. Nunnally has implicated that if a new questionnaire is going to be used, its value of Cronbach’s alpha should be at least 0.7 [19]. The test and retest values for internal consistency of Punjabi BI were equal to 0.937 and 0.923. The high reliability of Punjabi BI indicates that scores of patients remain stable after repeated measurements. Cross-cultural adaptation of a questionnaire for use in a new setting is time consuming and costly. However, where it is necessary to give details about oneself, this method assigned gives dentical and standard measurement of the data to be collected.
Conclusion
The translated version of Vertigo Symptom Scale has been demonstrated to be reliable, valid, acceptable and simple to understand by the patients. Data analysis show satisfactory high internal consistency and also the translated version were able to differentiate population with dizziness and without dizziness.
REFERENCES
- Baloh RW. Vertigo. The Lancet. 1998;352:1841-1846.
- Yardley L, Masson E, Verschuur C, Haacke N, Luxon L. Symptoms, anxiety and handicap in dizzy patients: development of the vertigo symptom scale. Journal of Psychosomatic Research. 1992;36:731-741.
- Aslan S, Ceylan A, Kemaloglu YK, Goksu N. Validity and reliability of the Turkish version of the Vertigo Handicap Questionnaire (VHQ) in a group of patients with vertigo. Gazi Medical Journal. 2003;14:167-173.
- Guerraz M, Yardley L, Bertholon P, Pollak L, Rudge P, et al. Visual vertigo: Symptom assessment, spatial orientation and postural control. Brain. 2001;124:1646-1656.
- Fukuhara S, Bito S, Green J, Hsiao A, Kurokawa K. Translation, adaptation, and validation of the SF-36 Health Survey for use in Japan. Journal of clinical epidemiology. 1998;51:1037-1044.
- Wiesinger GF, Nuhr M, Quittan M, Ebenbichler G, Wölfl G, Fialka-Moser V. Cross-cultural adaptation of the Roland-Morris questionnaire for German-speaking patients with low back pain. Spine. 1999;24:1099-1103.
- Beaton DE, Bombardier C, Guillemin F, Ferraz MB. Guidelines for the process of cross-cultural adaptation of self-report measures. Spine. 2000;25:3186-3191.
- Kamalvand A, Ghahraman MG, Jalaie S. Development of the Persian version of the Vertigo Symptom Scale: Validity and reliability. Journal of Research in Medical Sciences. 2017;22:1-7.
- Wild D, Grove A, Martin M, Eremenco S, McElroy S, Verjee‐Lorenz A, et al. Principles of good practice for the translation and cultural adaptation process for patient‐reported outcomes (PRO) measures: A report of the ISPOR Task Force for Translation and Cultural Adaptation. Value in health. 2005;8:94-104.
- George D, Mallery M. Using SPSS for Windows step by step: A simple guide and reference. Boston: Allyn and Bacon, UK, 2003.
- Memari AH, Shayestehfar M, Hafizi S. Cross-cultural adaptation, reliability, and validity of the autism treatment evaluation checklist in Persian. Iranian Journal of Pediatrics. 2013;23:269-275.
- Morley D, Selai C, Thompson A. The self-report Barthel Index: Preliminary validation in people with Parkinson’s disease. European Journal of Neurology. 2012;19:927-929.
- Fowler J, Jarvis P, Chevannes M. Practical statistics for nursing and health care. Chichester, New York: John Wiley & Sons, USA, 2013.
- Leplege A, Verdier A. The adaptation of health status measures: A discussion of certain methodological aspects of the translation procedure. In: The International Assessment of Health-Related Quality of Life: Theory, Translation, Measurement and Analysis. Oxford, UK: Rapid Communication of Oxford, 1995.
- Eremenco SL, Cella D, Arnold BJ. A comprehensive method for the translation and crosscultural validation of health status questionnaires. Evaluation and Health Profession. 2005;28:212-232.
- Cuesta-Vargas A, Gabel PC. Cross-cultural adaptation, reliability and validity of the Spanish version of the upper limb functional index. Health and Quality of Life Outcomes. 2013;11:126.
- Domínguez R, Vila JF, Augustovski F, Irazola V, Castillo PR, Escalante RR, et al. Spanish cross-cultural adaptation and validation of the National Institutes of Health Stroke Scale. Mayo Clinic Proceedings. 2006;81:476-480.
- Kline P. Test construction: Factor analytic and item analytic methods: Handbook of Psychological Testing. Routledge, UK, 2000.
- Nunnally JC, Bernstein IH. Psychometric Theory. New York: McGraw-Hill, USA, 1994.
Citation: Kaur H, Vohra S, Kaur RS (2019) Cross-Cultural Adaptation of English version of Vertigo Symptom Scale in Punjabi. Brain Disord Ther 8:254. doi: 10.35248/2168-975X.19.8.254
Copyright: © 2019 Kaur H, et al. This is an open-access article distributed under the terms of the Creative Commons Attribution License, which permits unrestricted use, distribution, and reproduction in any medium, provided the original author and source are credited.
