


Indexed In
- Academic Journals Database
- Open J Gate
- Genamics JournalSeek
- JournalTOCs
- China National Knowledge Infrastructure (CNKI)
- Scimago
- Ulrich's Periodicals Directory
- RefSeek
- Hamdard University
- EBSCO A-Z
- OCLC- WorldCat
- Publons
- MIAR
- University Grants Commission
- Geneva Foundation for Medical Education and Research
- Euro Pub
- Google Scholar
Useful Links
Share This Page
Open Access Journals
- Agri and Aquaculture
- Biochemistry
- Bioinformatics & Systems Biology
- Business & Management
- Chemistry
- Clinical Sciences
- Engineering
- Food & Nutrition
- General Science
- Genetics & Molecular Biology
- Immunology & Microbiology
- Medical Sciences
- Neuroscience & Psychology
- Nursing & Health Care
- Pharmaceutical Sciences
Research Article - (2020) Volume 11, Issue 6
Covid-19 Transmission Dynamics During the Unlock Phase and Significance of Testing
Abhijit Paul1, Samrat Chatterjee1 and Nandadulal Bairagi2*2Centre for Mathematical Biology and Ecology, Deptartment of Mathematics, Jadavpur University, Kolkata 700032, India
Received: 12-Oct-2020 Published: 02-Nov-2020, DOI: 10.35248/2157-7560.20.11.433
Abstract
The pandemic disease Covid-19 caused by SARS-COV-2 has established itself as the most devastating disease in the history of infectious disease, affecting 216 countries/territories across the globe. Policies like social distancing and lockdown were adopted to tackle the spreading of the disease. The disease is still not under control, but many countries have withdrawn the lockdown and going through phase-wise unlock-ing process. The removal of movement restriction causes free circulation of the disease mostly through the undetected class. The present study is an attempt to understand and estimate the possible epidemic burden during the unlock phase in the presence of the undetected class. Through a modified SEIR model, we focus our study on India and the USA, where the epidemic curve is still growing and the unlock process has started. We estimated the parameter values for both the countries using available data and used them to calculate the basic reproduction number. We also performed a global sensitivity analysis to search for the most sensitive parameters which can significantly change the dynamics of the disease. We observed that the use of repurposing drugs may further decrease the infected cases and help the disease controlling process. Our results emphasize on the implementation of 3T principles, trace, test, and treat, to contain the epidemic. The significance of large-scale testing in restricting the spread of infection during the unlock phase is evident for both India and the USA though they have different socio-economic conditions.
Keywords
Covid-19 pandemic; Epidemic model; Basic reproduction number; Control policy; Repurposing drugs
Introduction
The coronavirus disease 2019 (Covid-19), which originated from Wuhan, China, and declared as a pandemic by the World Health Organization (WHO) on March 11, 2020 [1], has put several countries under total or partial lockdown. After observing significant days of lockdown, many countries either have withdrawn or are planning to withdraw the lockdown in phases, even though the epidemic situation is not conducive and the aftermath of withdrawal is mostly unknown. Following the advice of WHO [2], health administrators are paying more attention to large scale testing to trace the symptomatic and asymptomatic covid positive cases [3-5]. Many countries have followed this instruction and intensified the covid testing, which has helped to trace and isolate the infectives more quickly so that the spreading chain can be discontinued [6,7]. Country-wise data on the testing till 21st August showed that Italy, Spain, Germany and Switzerland crossed 1,00,000 tests per million population, while the USA, Israel, Russia and UK crossed more than 2,00,000 tests per million population [6,7]. However, most of the African, South American and Asian countries including India have a testing rate of 60,000 per million or less, which is significantly low and is a hurdle in the prevention and control measures [6, 7]. This is because of the shortage of test kits, face masks and PPE (Personal Protection Equipment) across the world as well as their high cost, causing a big hurdle in the detection of covid cases [5,8,9]. The undetected infected individuals play an important role in spreading the disease and posing a challenge in the containment policies of the government [10-12]. This class will certainly be more influential during the unlock period because of their unrestricted movement. The present study is an attempt to understand and estimate the possible epidemiological burden of a country during the unlock period in the presence of undetected class and discuss some policy to combat the epidemic during the unlock period.
The trend of an epidemic can be better understood, even in the case of an unusually fast outbreak like Covid-19, through mathematical models. Several such mathematical models [13-21] have been proposed and analyzed for Covid-19 pandemic since its outbreak. These models used available data to predict the expected cases in the
near future and the number of deaths. The prediction about the epidemic peak, cases during the peak periods, and the information about its duration help policymakers to make necessary plans to fight against the epidemic [22-25]. Some models were made for multiple countries [10,19,26] and some were focused on specific countries like China [11], Cameroon [12], Italy [27,28] and India [29-33]. These studies considered different models on early Covid-19 transmission dynamics and predicted the epidemic burden as well as the future of the diseases in the presence or absence of lockdown. The current study differs from the mentioned studies and considers mainly the epidemic status during the unlock phase. As mentioned earlier, the undetected positive individuals may change the epidemiological burden and are crucial from the management viewpoint. We are, therefore, kin to know the effect of such class in the unlock phase and find a way out to reduce the number of infectives during this period. We studied the Covid-19 disease dynamics of countries like India and the USA, where the epidemic curve is still growing even after implementing a longer lockdown, to identify the possible reasons for not flattening of the curve. The undetected infectives are possibly one of the main reasons for making the policymakers upset as the outcome from the intervention measures was far from the expectation. The aim of the current study is to dissect the possible influence of the undetected infective class on the disease dynamics during the unlock period and make some policy hypotheses to combat the infection spreading during this period.
The paper is divided into several sections with model construction in the immediate next Section 2. Section 3 deals with the countrywise model analysis. In Section 4, we studied the significance of undetected infected individuals in the spreading of Covid-19. We looked for possible policy hypotheses through parameter recalibration in Section 5. The article ends with a conclusion in Section 7 following a discussion in Section 6.
Materials and Methods
The mathematical model
Our proposed model is based on the classical SEIR (Susceptible, Exposed, Infectious, Recovered) epidemic model. However, an extension in this basic model was done to incorporate other compartments in the population based on the characteristics of Covid-19 infection. Depending on the epidemiological status of an individual, we classified the population into Susceptible (S), Exposed (E), Detected Infectious (Id), Undetected Infectious (Iu), Recovered from the Detected Class (Rd) and Recovered from the Undetected Class (Ru). Besides, to give accountability on the virulence of the disease, deaths from the Detected Class (Dd) and deaths from the Undetected Class (Du) have also been considered (Figure 1).

Figure 1: Schematic diagram of our proposed Covid-19 epidemic model.
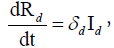
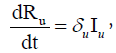
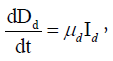
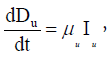
Each individual is assumed to be susceptible to SARS-COV-2 because it is a novel virus and there is no immunity against it. It is reported that a large portion of covid positive individuals does not show any symptoms or show mild symptoms [34,35], and a portion of such asymptomatic covid positive individuals remains undetected [36,37]. It is to be mentioned that an asymptomatic individual may be a member of Id class if Covid-19 infection is confirmed by rapid antigen or Polymerase Chain Reaction (PCR) test, but no member of Iu class has gone through the test. Susceptible individuals (S) get infection from both the detected (Id) and undetected (Iu) infectious individuals. Detected covid positive individuals are assumed to spread infection at a lower rate as they are identified, and this fact is incorporated in the incidence rate by a scaling parameter α (0< α<1). The disease incidence rate or the rate of new infection is assumed to follow nonlinear incidence, as it better fits the epidemiological data compared to bilinear incidence [38], with β as the disease transmission coefficient. All newly infected individuals join the exposed class E, who carry the virus but do not spread infection, and individuals leave this class at a rate ξ after spending an average time 1/ξ units (day). Note that the median period in staying E class is 3.69 day [39], giving the value of ξ in between 0 and 1. A fraction γ (0< γ < 1) of them join Id class and the remaining fraction (1 − γ) becomes the member of Iu class. An individual of undetected class may join the detected class if tested positive later on, and such transformation from Iu class to Id class may occur at a rate ω. Transformation from Id class to Rd class through recovery occurs at a rate δd and a similar transformation rate from Iu class to Ru class is denoted by δu. The disease-related death rates in the Id and Iu classes are denoted, respectively, by μd and μu, and these individuals join the respective death classes Dd and Du. The parameters δd, δu, μd, μu and ω all lie in between 0 and 1. We assume that the total population (N) remains constant throughout the study period, a reasonable assumption if the epidemic period is not too long. The interaction among different classes with these assumptions may be represented by the following system of differential equations (Equation 1).
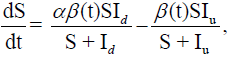
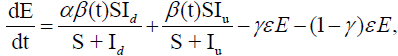
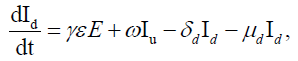
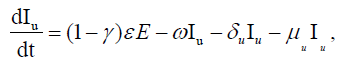 (1)
(1)
where
Here  is the disease transmission efficiency in the presence
of lockdown with
is the disease transmission efficiency in the presence
of lockdown with  as the baseline disease transmission rate. In
fact, the parameter ν encapsulates the effect of lockdown. Thus, ν takes the value 0 if there is no lockdown, otherwise 0< ν <1. Public
perception of getting an infection may act negatively on disease
transmission. This perception grows with increasing coronavirus-
related death [40,41]. The last expression accounts for such
perception and affects negatively on the disease transmission due
to human behavioral responses to deaths, where l measures the
strength of this response.
as the baseline disease transmission rate. In
fact, the parameter ν encapsulates the effect of lockdown. Thus, ν takes the value 0 if there is no lockdown, otherwise 0< ν <1. Public
perception of getting an infection may act negatively on disease
transmission. This perception grows with increasing coronavirus-
related death [40,41]. The last expression accounts for such
perception and affects negatively on the disease transmission due
to human behavioral responses to deaths, where l measures the
strength of this response.
Basic reproduction number
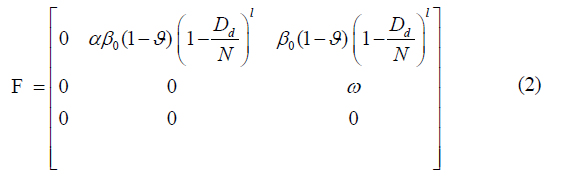
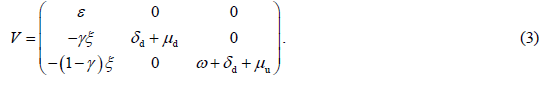
The basic reproduction number determines whether an infection will spread in the community or not. It is the average number of secondary cases produced by an index case. If this number is greater than 1 then an epidemic can grow, otherwise, it dies out [42]. Close to the Disease-Free Equilibrium (DFE) of model (1), a state in which S=N (N being the constant population size) and E=Id=Iu=0, the Jacobian matrix of the infection subsystem {E, Id, Iu} is J0=F −V, where F is the transmission matrix and V is the transition matrix. The basic reproduction number (R0) is the spectral radius of the Next Generation Matrix (NGM) [43], where, (Equations 2-5),
NGM=FV −1. For our model,
and
The Next Generation Matrix (NGM) then can be found as
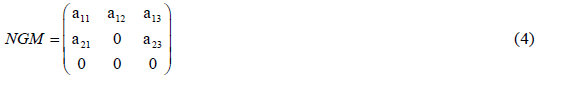
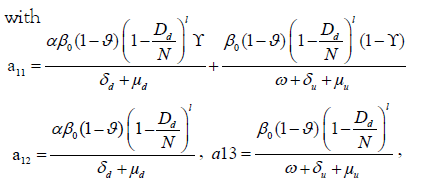
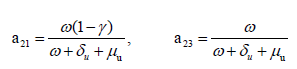
The Characteristic polynomial of this NGM is
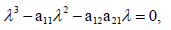 (5)
(5)
having roots
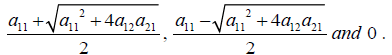
Noting that a11, a12 and a21 are always positive, as because of 0< ν <
1, 0< γ <1 and Dd<N, the only positive root of (5) is 
Therefore, following [43], the basic reproduction number of our system is
Simulation results
The country-wise temporal data of Covid-19 disease was taken from a web-based interactive dashboard maintained by the Centre for Systems Science and Engineering (CSSE) at Johns Hopkins University [44,45]. The rationale to develop this type of dashboard is to visualize and track reported cases of Covid-19 in real-time and make these data freely available for knowledge development. We have used the country-wise Covid-19 outbreak data of confirmed, recovered, and death cases till October 9, 2020. We considered the data for India and the US, where unlocking has started without achieving the epidemic peak (Figure 2).

Figure 2: Comparison between the model simulation data (red colour curve) and the reported data (blue colour curve) of India and the USA. The data contains case information for the period January 30 to October 9 for India and January 22 to October 9 for the USA. The parameter values for the simulation are given in Table 1. Three critical time points that separate the study period are mentioned in the labels of the figures.
Analysis for India and U.S
Parameter estimation: It was difficult to find a single parameter set
that fits the data for the entire epidemic period because lockdown
affected the disease spreading rate and consequently some model
parameters significantly changed their values in the pre-lockdown,
lockdown, and post- lockdown periods. We, therefore, partitioned
the study period into four-time segments, namely BLS (Before
Lockdown Stage), ELS (Early Lockdown Stage), LLS (Late Lockdown
Stage) and ULS (Unlock Stage), using three critical time-points
(see Supplementary Information and Supplementary Methods S1
for justification and technique). Only five parameters out of 11
parameters of the model were selected through global sensitivity
analysis (see Supplementary Methods S2 and Supplementary Figure
S1) and would be varied in the three-time segments (BLS, ELS
and LLS) keeping other parameters fixed. The optimal parameter
sets (see Table 1) were then generated for three-time segments using
“lsqcurvefit” function from the Optimization Toolbox of MATLAB
and by Mean Normalized Euclidean Distance (MNED) technique
(see Supplementary Methods S3 and S4). For the Unlock
Stage (ULS), the disease spreading rate of the detected infected
individuals is restricted to the rate of LLS, while the undetected
infected individuals are assumed to transmit the disease with a rate
same as ELS. Accordingly, we fixed the ULS values of β0 and ν similar to their respective values in LLS and ELS for the two classes,
respectively (  and ν1 for the detected class and
  and ν2for the
undetected class). Again the “lsqcurvefit” function was applied to
get the optimal parameter set (see Table 1) for this period. With
these optimal parameters, the model (1) was simulated for both
the countries and the results were compared with the real data (see Figure 2) (Table 1).
and ν2for the
undetected class). Again the “lsqcurvefit” function was applied to
get the optimal parameter set (see Table 1) for this period. With
these optimal parameters, the model (1) was simulated for both
the countries and the results were compared with the real data (see Figure 2) (Table 1).
| Country | ||
|---|---|---|
| Parameters/initial values | India | US |
| l | 10.5 | 7.25 |
| γ | 0.34 | 0.29 |
| ξ | 0.26 | 0.35 |
| ω | 0.33 | 0.27 |
| δu | 0.04 | 0.02 |
| µu | 0.0012 | 0.002 |
| Before lockdown stage (BLS) | ||
| α | 0.07 | 0.096 |
| β0 | 1.07 | 0.97 |
| ν | 0 | 0 |
| δd | 0.005 | 0.0019 |
| µd | 0.0028 | 0.0042 |
| Early lockdown stage (ELS) | ||
| α | 0.18 | 0.07 |
| β0 | 0.659 | 0.62 |
| ν | 0.41 | 0.31 |
| δd | 0.026 | 0.006 |
| µd | 0.0033 | 0.0053 |
| Later lockdown stage (LLS) | ||
| α | 0.228 | 0.08 |
| β0 | 0.62 | 0.4 |
| ν | 0.53 | 0.5 |
| δd | 0.048 | 0.009 |
| µd | 0.0023 | 0.0028 |
| Unlock stage (ULS) | ||
|
|
|
| ν1 | ν1 | ν1 |
|
|
|
| ν2 | ν2 | ν2 |
| α | α | α |
| γ | 0.34 | 0.58 |
| ω | 0.33 | 0.2 |
| δd | 0.097 | 0.0076 |
| δu | 0.08 | 0.017 |
| µd | 0.0016 | 0.00035 |
| µu | 0.0012 | 0.001 |
| Initial values of the variables | ||
| S0 | 135,26,42,280 [51, 52] | 32,92,27,746 [53] |
| E0 | 0 | 0 |
| Id0 | 1 | 1 |
| Iu0 | 0 | 0 |
| Rd0 | 0 | 0 |
| Ru0 | 0 | 0 |
| Dd0 | 0 | 0 |
| Du0 | 0 | 0 |
Table 1: Optimal parameters for BLS, ELS, LLS and ULS time segments, separated by the three critical time points, for India and USA. Parameters l, γ, ξ, ω, δu, μu remained fixed for each time segment, while the other five parameters differed. The first critical time points are March 25 for India and March 19 for the US, which are the lockdown starting dates of the two countries. The second critical time points for these countries are 45 days and 25 days, after the first critical point. The third critical point was the unlocking day, and it is July 1 for India and May 8 for the USA. The initial value of the susceptible population was considered as the population of the respective country.
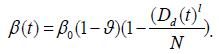
Lockdown effect on the disease transmission rate (β(t)) and basic reproduction number (R0) of India and the USA: The objective of lockdown is to reduce the transmission rate of the disease, represented by β(t), so that infection does not spread in the community. On the other hand, the health of the community is measured by the transmission potentiality measuring parameter, R0. We, therefore, observed the effect of lockdown on the parameter β(t) and index parameter R0. We plotted (Figure 3) the variation in the values of β(t) and R0 with respect to time. During BLS, these values were very high for both the countries, but it decreased later on and remained in between 1 and 2, implying that the disease is still not under control. Note that the transmission rate increased in both countries during the unlock period (Figure 3).

Figure 3: Variation in the disease transmission rate, β(t), and the basic reproduction number, R0, for India and USA with respect to time. The disease is still growing as the basic reproduction number is above the line of control, R0=1 (red color line).
Results and Discussion
Significance of undetected infected individual class in the spreading of covid-19
Estimating country-wise undetected infected individual: It is reported that 81% of Covid-19 infected individuals are mildly symptomatic or asymptomatic [46]. Unfortunately, a significant number of these asymptomatic cases remain undetected due to the limitation of testing facilities and unawareness of the population [39]. To capture the effect of undetected infected population in the spreading of disease, we plotted the time-series curve for the undetected infected class for both the countries in Figure 4. It shows that the number of undetected cases is still increasing in India and USA. Though there was a negative slope in the undetected infectives curve of the USA during April end to May middle, though USA couldn’t hold it up, and the number surged again (Figure 4).

Figure 4: Time evolutions of the undetected class (Iu) for both the countries with parameter values given in Table 1 with their respective period. The number of individuals in this class are increasing for both countries.
Prediction on the detected and undetected infected classes: The aim here is to catch the impact of undetected infected class on the disease spreading during the unlock phase in case of India and the US. As most of the undetected covid positive individuals are asymptomatic or mildly symptomatic, they do everything as healthy individuals do. During the unlock period, there will be no restriction in the movement and consequently, these undetected people would play a pivotal role in spreading the infection. There would be a high chance of community spreading during this period and contact tracing will be very difficult, and it may be even impossible in many cases. So the question is how can we reduce the undetected cases and restrict spreading during the unlock period? As mentioned earlier, some parameter values are expected to change in the unlock period compare to their lockdown values, which would contribute to worsening the epidemic situation in the unlocking stage. So a pertaining question is what changes we may expect in the detected and undetected classes if the parameter values during the unlock period are changed to the parameter values of the LLS period? For such comparison study, we plotted the fold change in the levels of Id, Rd, Dd, Iu, Ru and Dd after 1 month, 2 months and 3 months, considering the current values as their respective base values (Figure 5). The predicted levels of Id, Rd, Dd, Iu, Ru and Dd after 1 month, 2 months and 3 months are given in Supplementary Figure S3 for India and the same for the USA in Supplementary Figure S4. The blue color bars in Figure 5 represent the fold change in each class if there is no change in the parameter values of ULS period and the red color bars represent the fold change with respect to its October 9 value if the parameters take the value of the LLS period instead of ULS. For example, in India, under ULS condition the Id class population increases to 2, 3.86 and 7.48 times after one, two and three months from October 9. However, if it is restricted to LLS condition then the Id class population can be controlled and is only increased to 1.38, 1.77 and 2.27 times after one, two and three months from October 9. Thus, there would be a huge change in every compartment after three months of unlocking period if the parameter values can be changed to LLS stage. Similar changes are also observed in the case of the USA. In the next subsections, we demonstrate how to change the parameter values of the unlock period to the parameter values of the LLS period (Figure 5).

Figure 5: Fold change in the detected and undetected infectious compartments after one, two and three months under two different parametric situations. The blue bars represent the fold change if parameters take the ULS values, and the red bar represents the same if parameters take the LLS values (see Table 1). Fold change is measured taking October 9 value as their bases. The upper row represents the scenario for India and the lower row for the US.
Possible policy hypothesis through parameter recalibration
We looked for policies that could be implemented during the
unlock phase to restrict disease spreading. We used parameter
recalibration techniques to define such policies that may be
adopted to slow down the infection. To choose parameters
for our recalibration exercise, global sensitivity analysis (Figure 6 and
Supplementary methods S2) was used to identify the parameters
which have the potentiality to regulate the disease dynamics during
the unlock period. It is to be noted that the detected class and the
undetected class have different values for the parameters β0 and
ν during the unlock period, simply because the former has no or
limited movement, and the later has free movement. We, therefore,
considered different notations of β0 and ν for the two groups: and ν1 for the detected class, and and v2 for the undetected
class. Sensitivity analysis shows that α, , , ν1 and ν2 all are
sensitive parameters (Figure 6). However, these parameters cannot
be considered for recalibration exercise because during the unlock
period one has little or no control on these parameters, especially
in the case of undetected class, there is no control and the values
of these parameters are completely unknown. We, therefore,
looked for other parameters which are sensitive and controllable.
The parameters γ and ω, having negative PRCC values, are also
sensitive and they have more effect on the undetected class than
the detected one (see Figure 6). These two parameters are
measurable and selected them as the target parameters for our
recalibration exercise to hypothesize on the controlling measures.
It is mentionable that these two parameters can easily be controlled
through Covid-19 testing (Figure 6).

Figure 6: Sensitivity of Indian and US parameters during the unlock period. The parameters , are the baseline disease transmission rates and ν1, ν2are the restriction measuring parameters in the movement of detected and undetected infected classes.
We now look for the effect of these two parameters in controlling the disease progression during unlock period. In this process, we increased separately the values of γ and ω by 10%, 25% and 50% from their existing values of unlocking condition and estimated the fold change in the number of detected infected individuals (Id) and undetected infected individuals (Iu) after 1, 2 and 3 months (see Figure 7). These fold change values were compared with the corresponding fold change values of Id and Iu classes of Figure 5. Increased values of γ and ω reduced both the numbers of detected and undetected infected individuals significantly. For example, if the value of the transformation rate from E to Id class (γ) is increased by 10% of the existing rate, India would be able to reduce the number of future detected infected individuals by 4.7%, 11.7% and 18% in the next one, two and three months, respectively. If the value of the transformation rate from Iu to Id class (ω) is increased by 10%, then there would be 6.4%, 15.65% and 23.78% reduction in the number of future detected infected individuals in the next one, two and three months, respectively. The value might even reach close to the corresponding value of LLS condition with increase in these two parameter values. We also noticed a higher variation in the undetected class, Iu, compare to the detected class, Id (Figure 7).

Figure 7: Parameter recalibration. Fold change in the detected infected individuals (Id) and undetected infected individual (Iu) after one month (A, D), two months (B, E) and three months (C, F) due to an increment in the unlock values of γ and ω by 10%, 25% and 50%. Such fold changes have been represented by three consecutive bars under each parameter and compared with the corresponding fold change values of Id and Iu classes of Figure 5, marked here by ULS and LLS. Fold change is measured taking October 9 value as their bases. The upper row represents the scenario for India and the lower row for the US.
Recent studies have shown that the use of repurposing drugs like dexamethasone, Favipiravir and Remdesivir can help the infected individuals to recover fast, and simultaneously decrease the disease related death. The WHO has also recognized that the mortality rate of critically ill patients can be reduced at least by one-third by using the repurposing drugs [47]. Countries like USA, UK and India have recently approved its use for the treatment of critically ill Covid-19 patients [48-50]. Here we investigated the effect of repurposing drugs on Covid-19 disease dynamics. Interestingly, we observed from our global sensitivity analysis that the death rate (δd) and recovery rate (μd) of the detected class are sensitive parameter, particularly for detected class (see Figure 6). We, therefore, simultaneously increased the unlock value of δd and decreased the value of μd by 10%, 25%, 50%, and estimated the number of detected and undetected infected individuals after 1 month, 2 months and 3 months (see Figure 8). Simulation results clearly show a significant reduction in the number of both detected and undetected infectives [51-53]. In India, the number of detected infected individuals went close to the corresponding values of LLS condition (Figure 8).

Figure 8: Effect of the repurposing drugs. Fold change in the detected and undetected infected classes after one month (A, D), two months (B, E) and three months (C, F) due to a simultaneous increment in the parameter δd and a decrement in μd in the unlock values by 10%, 25% and 50%. Such fold changes have been represented by three consecutive bars (violet colour for 10%, green colour for 25% and blue colour for 50%) under each parameter and compared with the corresponding fold change values of Id and Iu classes of Figure 5, marked here by ULS and LLS. Fold change is measured taking October 9 value as their base values. The upper row represents the scenario for India and the lower row for the US.
Finally, we observed the effect of perception strength (l) on the disease outcome. For this, we varied the parameter (l) from 0 to 100 and observed (Figure 9) the fold change in the detected and undetected infectives after 3 months with respect to its value as of October 9. Figure 9 shows that there is a significant change in the Id and Iu classes. For example, if the value of l is increased to 3 times of the existing value, India would be able to reduce the number of detected and undetected infected individuals by 4.76% and 5.62%, respectively, in the next three months. For the USA, the corresponding reduction would be 4.4% and 8.87% (Figure 9).

Figure 9: Variational effect of human perception on the Id and Iu classes after three months taking October 9 as their base values. It shows a significant change in Id and Iu classes in the case of India when l varies in the range 0 to 100 (upper row). Such changes are little in the case of USA (lower row). The value of l for India and USA used throughout this paper are 10.5 and 7.25, which have been indicated by the red lines. Other parameters remain same with the unlock values (see Table 1).
The world has now started to come out of the lockdown imposed due to Covid-19 pandemic even though the infection rate is still in an increasing mood in many countries. In the absence of any specific drug or vaccine, the main weapons to fight against the pandemic under unlock condition remain the same, viz., maintaining social distancing and individual hygiene, compulsory use of mask, isolation of infectives or carriers. As the major portion of the infected individuals remains mildly symptomatic or asymptomatic, identification of such Covid-19 infected individuals is crucial for the containment of this deadly disease. This goal can be achieved if the potential individuals can be traced, tested and treated (3T principles) as quickly as possible so that the chances of spreading can be minimized. Though it may not be impossible, but definitely a hard task for many countries, where the population is large and/ or medical facilities and resources are limited. Testing capacity around the world has become stretched due to a shortage of critical supplies, including test kits and face masks, which may further decrease the covid testing and thereby increase the proportion of undetected infected individuals. As the movement restriction is eased during the unlock period, this undetected class may enhance the disease spreading rate. So, the present study aims to assess the impact of undetected class on the Covid-19 dynamics during the unlock period. We began our study by understanding the effect of lockdown in countries like India and the USA, where the peak of the epidemic curve is yet to reach. We proposed an extended SEIR epidemic model to address this problem. The disease transmission rate was modified to include the effect of lockdown and public perception of getting an infection. It was presumed that the negative effect on the disease transmission due to human perception of getting the infection would increase with the disease related death. Thus, the disease transmission rate, β(t), became a time dependent parameter, which is usually assumed to be a constant in the epidemic models.
The data of both countries were considered to estimate the parameter values and looked for the critical time point from where the effect of lockdown was observed. Our model simulation captured the disease spreading scenario of these two countries for the period of January end to October 2020. Global sensitivity analysis with an initial guess of the parameter set identified five parameters as the most sensitive. We further modulated these parameters to search for the critical time point for which our system shows a good fit of the actual data when compared between different lockdown stages. In this process, we partitioned the wholetime frame into four parts: Before Lockdown Stage (BLS), Early Lockdown Stage (ELS), Late Lockdown Stage (LLS) and Unlock Stage (ULS) by three critical time points. The lockdown phase was further divided into two parts,
viz ELS and LLS, for the best fit of the model with the observed data through optimization technique. For both countries, the epidemic curve is still growing with little impact of lockdown. Our simulation results showed that there exists a critical time point for both the countries where the effect of lockdown has been observed, but it was insufficient to flatten the curve. We noticed that the disease transmission coefficient, β(t), and the lockdown effect measuring parameter, ν, both decreased in the LLS stage from its previous stage. The decreased parameter values, however, reduced the transmission potentiality measure, R0, but could not pull it below 1. The value remained above 1 for both the countries, indicating that the epidemic is still in its growing stage. Possible reasons for the curve still to grow lies in the observation that lockdown was not so effective for India and the USA. In fact, ν value increased in the LLS from ELS for both the countries. The value of baseline disease transmission rate (β0) did not change much during LLS from ELS in case of India (see Table 1). The number of undetected infectives increased in both countries, which contributed a lot to the growing epidemic burden (see Figure 4). Under this scenario, where the curve is yet to reach its peak, both the countries decided to come out of the lockdown in phases by gradually removing the movement and other social restrictions. Withdrawal of such restrictions would increase the dissemination of infection in the community level, where contact tracing would be impossible in many cases. We, therefore, attempted to restrict the disease transmission rate during the unlock period at the level of the LLS stage, a much lower level in comparison to the current level.
To find out the strategy, we used the parameter recalibration technique, where the parameters are manipulated to see their effect on the model outcomes. This exercise identified two controllable sensitive parameters γ and ω. Recall that γ is the fraction of the exposed class who join the detected class Id through the identification of SARS-COV-2 in their body and the remaining fraction (1 − γ) becomes the member of Iu class without going through testing. The parameter ω represents the joining rate of detected class from the undetected class through testing at a later time. Thus, both parameters are measurable, and their values are linearly dependent on the number of tests performed. So, we considered these two parameters for our recalibration exercise and observed that the increase in these two parameters could slow down the epidemic growth curve. These two parameters could be increased by increasing the tracing and testing of individuals who are at risk, thereby increase the number of detected individuals. This would help to control the spreading of the disease as detected individuals have lower chance to infect others and could facilitate to break the chain. Our simulation results indicated (see Figure 7) that India could reduce the future cases by 18%, 23.78% at the end of three months if the value of γ, ω can be increased separately by 10% and for the USA the reduction percentages are 24.6%, 16.6%. This has been successfully tested in countries like South Korea and Hong Kong. These countries have proved that the control over coronavirus may be achieved without imposing lockdown, rather it can be done by increasing the test facilities, reducing the time for tracing and giving treatment at the earliest. We have also captured the significance of public perception of disease spreading and observed that it can significantly change the number of infectives. Such effects were observed in both the countries India and the USA despite their socio-economic differences. We have also observed the effect of repurposing drugs in reducing the fatality of the disease. However, since there is no vaccine and specific drugs for treating SARS-CoV-2 infected individuals, we have to fight against the virus with the available treatments and control strategies in the unlock period.
Conclusion
The present study is an attempt to understand and estimate the possible epidemic burden during the unlock phase in the presence of the undetected class. We focus on India and the USA, where the epidemic curve is still growing and the unlock process has started. Our study emphasizes that enhancing covid testing could reduce the epidemiological burden. The significance of large scale testing in restricting the spread of infection during the unlock phase is evident for both India and the USA though they have different socio-economic conditions. We believe our proposed strategy obtained through a mathematical model will help to make a better policy for the unlock phase.
Acknowledgements
The work is supported by SERB (Govt of India) under MATRICS Scheme, Ref. No. MSC/2020/000020. Research of AP is supported by University Grants Commission (11-04- 2016-423482) Govt. of India.
Conflict of Interest
The authors declare that there is no competing interest.
REFERENCES
- World Health Organization. WHO Director-General’s opening remarks at the media briefing on Covid-19. 2020.
- Seidu AA, Hagan Jr JE, Ameyaw EK, Ahinkorah BO, Schack T. The role of testing in infectious disease control: A case of COVID-19 in Africa. Int J Inf Dis. 2020; 98: 237-240.
- Centers for Disease Control and Prevention. Overview of Testing for SARS-CoV-2 (COVID-19). 2020.
- FDA. Coronavirus (Covid-19) Update: Facilitating Diagnostic Test Availability for Asymptomatic Testing and Sample Pooling. 2020.
- Padula WV. Why only test symptomatic patients? Consider random screening for COVID-19. Appl Hea Econ Hea Policy. 2020; z18:333–334.
- Statista. Rate of coronavirus (COVID-19) tests performed in the most impacted countries worldwide as of August 21,2020 (per million population). 2020.
- Worldometer. Coronavirus Update (Live). 2020.
- Ranney ML, Griffeth V, Jha AK. Critical supply shortages: The need for ventilators and personal protective equipment during the Covid-19 pandemic. New Eng J Med. 2020; 382(18): 41.
- Behnam M, Dey A, Gambell T, Talwar V. Covid-19: Overcoming supply shortages for diagnostic testing. McKinsey & Company. 2020.
- Picchiotti N, Salvioli M, Zanardini E, Missale F. Covid-19 pandemic: A mobility- dependent SEIR model with undetected cases in Italy, Europe and US. Preprint arXiv. 2005; 08882.
- Ivorra B, Ferr´andez MR, Vela-P´erez M, Ramos AM. Mathematical modeling of the spread of the coronavirus disease 2019 (Covid-19) taking into account the undetected infections. The case of China. Commu Nonlin Sci and Num Sim. 2020; 88: 1-21.
- Ngondiep E. An efficient explicit approach for predicting the Covid-19 spreading with undetected infectious: The case of Cameroon. arXiv Preprint arXiv.2005; 11279 2020.
- Roosa K, Lee Y, Luo R, Kirpich A, Rothenberg R, Hyman JM, et al. Real-time forecasts of the COVID-19 epidemic in China from February 5th to February 24th, 2020. Infec Dis Modelling. 2020; 1(5): 256-263.
- Kucharski AJ, Russell TW, Diamond C, Liu Y, Edmunds J, Funk S et al. Early dy- namics of transmission and control of COVID-19: a mathematical modelling study. Lancet Infec Dis. 2020; 20(5): 553-558
- Read JM, Bridgen JR, Cummings DA, Ho A, Jewell CP. Novel coronavirus 2019-nCoV: Early estimation of epidemiological parameters and epidemic predictions. MedRxiv. 2020.
- Lai S, Bogoch II, Ruktanonchai NW, Watts A, Lu X, Yang W et al. Assessing spread risk of Wuhan novel coronavirus within and beyond China, January-April 2020: A travel network-based modelling study. medRxiv. 2020.
- Muniz-Rodriguez K, Chowell G, Cheung CH, Jia D, Lai PY, Lee Y et al. Doubling time of the COVID-19 epidemic by province, China. Emerg Infec Dis. 2020; 26(8): 1912.
- Wu JT, Leung K, Leung GM. Nowcasting and forecasting the potential domestic and international spread of the 2019-nCoV outbreak originating in Wuhan, China: A modelling study. The Lancet. 2020; 395(10225): 689-697.
- Paul A, Chatterjee S, Bairagi N. Prediction on Covid-19 epidemic for different countries: Focusing on South Asia under various precautionary measures. medRxiv 2020.
- Mondal C, Adak D, Majumder A, Bairagi N. Mitigating the transmission of infection and death due to SARS-CoV-2 through non-pharmaceutical interventions and repurposing drugs. ISA Transactions. 2020.
- Adak D, Majumder A, Bairagi N. Mathematical Perspective of Covid-19 Pandemic: Disease Extinction Criteria in Deterministic and Stochastic Models. Ch Soli Fract. 2020.
- Wang N, Fu Y, Zhang H, Shi H. An evaluation of mathematical models for the outbreak of COVID-19. Preci Clin Medi. 2020; 3(2): 85-93.
- Wang J. Mathematical models for COVID-19: applications, limitations, and potentials. Journal of public health and emergency 2020; 4(12): 165-174.
- Anderson RM, Heesterbeek H, Klinkenberg D, Hollingsworth TD. How will country- based mitigation measures influence the course of the COVID-19 epidemic. The Lancet. 2020; 395(10228): 931-934.
- Jewell NP, Lewnard JA, Jewell BL. Predictive mathematical models of the COVID-19 pandemic: Underlying principles and value of projections. Jama. 2020; 323(19): 1893-1894.
- Carletti T, Fanelli D, Piazza F. COVID-19: The unreasonable effectiveness of simple models. arXiv preprint arXiv.2005.
- Gatto M, Bertuzzo E, Mari L, Miccoli S, Carraro L, Casagrandi R et al. Spread and dynamics of the Covid-19 epidemic in Italy: Effects of emergency containment measures. Proc Nat Aca Sci. 2020;17(19):10484-10491.
- Bertuzzo E, Mari L, Pasetto D, Miccoli S, Casagrandi R, Gatto M, et al. The geography of Covid-19 spread in Italy and implications for the relaxation of confinement measures. medRxiv. 2020.
- Shah K, Awasthi A, Modi B, Kundapur R, Saxena DB. Unfolding trends of Covid-19 transmission in India: Critical review of available Mathematical models. Indian J Comm Health. 2020; 32(2): 206-214.
- Das A, Dhar A, Goyal S, Kundu A. Covid-19: An analysis of an extended SEIR model and a comparison of different intervention strategies. arXiv.2005.
- Chatterjee K, Chatterjee K, Kumar A, Shankar S. Healthcare impact of COVID-19 epidemic in India: A stochastic mathematical model. Med J Armed India. 2020.
- Singh J, Ahluwalia PK, Kumar A. Mathematical Model Based COVID-19 Prediction in India and its Different States. medRxiv. 2020.
- Biswas SK, Ghosh JK, Sarkar S, Ghosh U. COVID-19 Pandemic in India: A Mathematical Model Study. Preprints. 2020.
- Lu S, Lin J, Zhang Z, Xiao L, Jiang Z, Chen J, et al. Alert for non-respiratory symptoms of Coronavirus Disease 2019 (COVID-19) patients in epidemic period: A case report of familial cluster with three asymptomatic COVID-19 patients. J Med Viro. 2020.
- Ruan Q, Yang K, Wang W, Jiang L, Song J. Clinical predictors of mortality due to COVID-19 based on an analysis of data of 150 patients from Wuhan, China. Int Care Medi. 2020; 46(5): 846-848.
- Yu X, Yang R. COVID-19 transmission through asymptomatic carriers is a challenge to containment. Influenza Other Respi Viruses. 2020; 14(4): 474-475.
- Pedersen MG, Meneghini M. Quantifying undetected COVID-19 cases and effects of containment measures in Italy. ResearchGate Preprint. 2020.
- Capasso V, Serio G. A generalization of the Kermack-McKendrick deterministic epidemic model. Mathematical Biosciences. 1978; 1(2): 43-61.
- Li R, Pei S, Chen B, Song Y, Zhang T, Yang W, et al. Substantial undocumented infection facilitates the rapid dissemination of novel coronavirus (SARS-CoV-2). Science 2020; 368(6490): 489-493.
- He D, Dushoff J, Day T, Ma J, Earn DJ. Inferring the causes of the three waves of the 1918 influenza pandemic in England and Wales. Proc Royal Society: Bio Sci. 2013; 280(1766): 20131345.
- Lin Q, Zhao S, Gao D, Lou Y, Yang S, Musa SS, et al. A conceptual model for the outbreak of Coronavirus disease 2019 (COVID-19) in Wuhan, China with individual reaction and governmental action. Int J Inf Dis. 2020.
- Dietz K. The estimation of the basic reproduction number for infectious diseases. Stat Met Med Res.1993; 2(1): 23-41.
- Van den Driessche P. Reproduction numbers of infectious disease models. Inf Dis Mod. 2017; 2(3): 288-303.
- 2019 Novel Coronavirus Covid-19 (2019-nCoV) Data Repository by Johns Hopkins CSSE. 2020.
- John Hopkins University of Medicine. Covid-19 Map-John Hopkins Coronavirus Re- source Center.
- Wu Z, McGoogan JM. Characteristics of and important lessons from the coronavirus disease 2019 (COVID-19) outbreak in China: Summary of a report of 72 314 cases from the Chinese Center for Disease Control and Prevention. Jama. 2020; 323(13): 1239- 1242.
- World Health Organization. Dexamethasone and COVID-19. 2020.
- European Medicines Agency (EMA). First COVID-19 treatment recommended for EU authorization. 2020.
- United States Department of Health & Human Services (HHS). Trump Administration Secures New Supplies of Remdesivir for the United States. 2020.
- Press Information Bureau, Government of India. Cost Effective Process Technology of Favipiravir Developed by CSIR. 2020.
- Demographics of India. 2020.
- Central Intelligence Agency. South Asia. India. 2020.
- United States Census Bureau. Population Clock. 2020
Citation: Paul A, Chatterjee S, Bairagi N (2020) Transmission Dynamics During the Unlock Phase and Significance of Testing. J Vaccines Vaccin. 11:433.
Copyright: © 2020 Paul A, et al. This is an open-access article distributed under the terms of the Creative Commons Attribution License, which permits unrestricted use, distribution, and reproduction in any medium, provided the original author and source are credited.