Indexed In
- Academic Journals Database
- Open J Gate
- Genamics JournalSeek
- JournalTOCs
- China National Knowledge Infrastructure (CNKI)
- Scimago
- Ulrich's Periodicals Directory
- RefSeek
- Hamdard University
- EBSCO A-Z
- OCLC- WorldCat
- Publons
- MIAR
- University Grants Commission
- Geneva Foundation for Medical Education and Research
- Euro Pub
- Google Scholar
Useful Links
Share This Page
Open Access Journals
- Agri and Aquaculture
- Biochemistry
- Bioinformatics & Systems Biology
- Business & Management
- Chemistry
- Clinical Sciences
- Engineering
- Food & Nutrition
- General Science
- Genetics & Molecular Biology
- Immunology & Microbiology
- Medical Sciences
- Neuroscience & Psychology
- Nursing & Health Care
- Pharmaceutical Sciences
Research Article - (2020) Volume 0, Issue 0
COVID Vaccine Transport, Storage and Distribution: Cold Chain Management to Ensure Efficacy
Michael Rusnack*Received: 31-Aug-2020 Published: 21-Oct-2020, DOI: 10.35248/2157-7560.20.S4.001
Abstract
The Vaccines for Children Program (VFC) is a federally funded program in the United States, providing vaccines to children who lack health insurance or who otherwise cannot afford the cost of the vaccination. The VFC program was created in 1993 and is required to be a new entitlement of each State's Medicaid plan. The program was officially implemented in October 1994 and served eligible children in all United States (US). Other countries, the United Nations (UN), and the World Health Organization (WHO) have similar programs.
A critical aspect of these programs is the guidance surrounding the environmental monitoring of the materials. To best maintain the integrity of these products, specific storage parameters are required. It is necessary to store most vaccines at refrigeration or freezing temperatures. To best assure the efficacy of the vaccines, monitoring standards and equipment is specified. The technology and methodologies may be adequate for the materials for these programs; these same methods are not for the COVID vaccine.
When reviewing the guidance recommendations worldwide, one may observe commonalities in the program. Each guidance calls for the use of digital data loggers (DDL), sampling rates of 15 to 30 minutes, daily check-in (during business hours), and the use of a temperature buffer, each without specificity.
This manuscript will describe the inadequacies of the VFC program monitoring while demonstrating how these methods fall far short when monitoring COVID vaccines. Herein considerations for the transport, storage, and distribution of the COVID vaccine cold chain will be discussed.
Keywords
Covid vaccine monitoring; Cold chain monitoring; Temperature monitoring; Transportation; Temperature buffer; Wireless monitor; Internet of things (Iot); Remote monitoring
Introduction
In the US, the Center for Disease Control and Prevention (CDC) gives guidance for vaccine storage and handling. The CDC, in conjunction with the National Institute of Standards and Technology (NIST), has developed the standards for the VFC monitoring program. These specifications have become the basis for much of the monitoring standards in pharmaceutical monitoring. The advancement of technology in the sensing hardware being utilized is a break from the VFC standards [1]. Given the higher value of the stored good (i.e., pharmaceuticals, medications, reagents, etc.), continuous monitoring is widely deployed. Advancements in wireless technology have enabled connectivity to cloud servers, allowing recorded data to be easily accessed [2].
The use of a temperature buffer is specified in the VFC guidance; however, neither the volume nor geometry is defined. Similarly, the rate at which samples are recorded is quite broad and a throwback to the original data logger capacity [3]. Despite the availability of continuous, real-time monitoring, daily check-in is a requirement. Here again, with automated systems that monitor 24 × 7, configurable alerting that is capable of voice, SMS (text) and email notification, users are required to record the temperature during work hours. The current "manual" system completely disregards any temperature excursions that may happen between daily checkin periods or on weekends and holidays [4].
Improper storage and handling results in as much as 35 percent of vaccines shipped worldwide wasted due to improper storage and transport. [NIST] Much of this can be attributed to outdated equipment, methods, and procedures utilized [5]. The VFC program and pharmaceutical monitoring represented the best available technology at the time of its implementation. The guidance has updated each year; however, it has failed to advance to the currently available technology and methodologies. Not all of these spoiled vaccines and medications are discarded; they are distributed and utilized as viable. These results lead one to examine the consequence of such actions [6-8].
Materials and Methods
Logistics for pharmaceuticals have long experienced cold chain management-generally, keeping the materials at 2 to 8°C (35 to 46°F) during storage and transport. The advancement in recent years for cellular and genetic therapies, which involve live cells, has resulted in a growing need for deep-frozen storage: -80°C (-1120F) or even -180°C (-292°F) requiring liquid nitrogen (LN2). It now appears that at least some of the certain COVID-19 vaccines will need to be stored at ultra-low temperatures [9-11].
Once they [cell and gene therapies] are on-site, human cells and the raw materials required for manufacturing must be carefully stored to maintain them. When assessing risk in these storage areas and implementing controls to prevent failure, manufacturers must consider that patient material is irreplaceable [12].
Real-time monitoring
The protocols established for the VFC programs are to review and record the state of the storage unit monitors twice daily during business hours, with no monitoring on weekends and holidays. Technological advancements in server architecture and wireless communication have enabled real-time monitoring and recordation. The result is a 24 × 7 data flow, which results in a continuously updated data presentation [13].
Minimal hardware required
With cloud computing, lower cost, scalable solutions are available to the end-user. Simply put, cloud computing is the delivery of computing services-including servers, storage, databases, networking, software, analytics, and intelligence-over the Internet ("the cloud") to offer faster innovation, flexible resources, and economies of scale. You typically pay only for cloud services you use, helping you lower your operating costs, run your infrastructure more efficiently, and scale as your business needs change.
As a result of cloud computing, the integration of a monitoring solution is simplified. No longer is there a need for the expense of an on-site server. The facility and management costs are no longer a concern. The solution provider manages all of these services, eliminating the impact on the Information Technology (IT) department [14].
Connectivity
The path to the cloud servers is via the Internet. The two most common methods of connecting to the Internet includes direct connect (via LAN) and wireless. Wi-Fi is the most prevalent method for addressing data over the Internet. Both LAN and Wi- Fi solutions require the services of the IT department.
In an existing facility where the Wi-Fi network is established and operational, the IT department is burdened with:
Different standards and protocols: Many types of wireless devices are used in the healthcare system. Multiple devices are integrated to monitor a single patient at times. The variance in the standards and protocols of these devices make it difficult to integrate and interpret the data.
Security and privacy: The data between a doctor and a patient is bound by Doctor-patient confidentiality (HIPAA). The easy availability of and access to the data can compromise the security of personal health information of both the patient and the doctor. Additionally, weak security can allow the same access to the client network, exposing the healthcare system to ransom ware.
Data overload: Various devices are used with Wi-Fi technology, all of which may not have the same communication protocols and standards. This can lead to a tremendous amount of data to be aggregated, all of which may not be effective in interpreting sensibly.
System management: The IT department is now taxed with the responsibility of managing these connected devices on their already saturated network. System upgrades may now adversely affect these connected devices as they may lag in the compliance and connectivity standards.
Though the burden is less with a LAN solution, these same issues overload the IT department as they work to accommodate the increased traffic. When outfitting a new facility, the complexity and expense of the solution is multiplied manifold [15].
With IoT (Internet of Things) technology, coupled with the pervasiveness of the Internet, a new era of sensing technology is ushered into use.
Definitions vary when describing IoT:
• IoT is about extending the power of the Internet beyond computers and smartphones to a whole range of other things, processes, and environments. (IoT for All)
• IoT is the extension of internet connectivity into physical devices and everyday objects. Embedded with electronics, internet connectivity, and other forms of hardware (such as sensors), these devices can communicate and interact with others over the Internet. They can be remotely monitored and controlled. (Wikipedia)
• IoT refers to a vast number of "things" that are connected to the Internet so they can share data with other things – IoT applications, connected devices, industrial machines, and more. Internet-connected devices use built-in sensors to collect data and act on it. (SAS)
Cellular IoT provides wireless connectivity while being completely independent of the IT department; it should not be confused with Wi-Fi enable IoT devices as they open an entirely new and unique problem set.
Sensors
The data logger presently utilized for vaccine monitoring is not suited for monitoring temperatures below -40°C (-40°F). These devices use a thermistor or digital temperature sensor. The accuracy of this family of devices at low temperatures decreases as they become very nonlinear — the data below the -40°C (-40°F) is no longer viable.
Accurate measurements at these temperatures require the use of thermocouples or resistance temperature detectors (RTDs). There are pros and cons to each device. The thermocouple is a wire pair, with the sensing end either welded or twisted; the small form-factor allows for easy placement. Comparatively, the RTD sensing mechanism is typically encased in a stainless-steel tube; this presents a challenge when placing the sensing probe.
The modern-day production of RTD and precision electronics results in a very accurate and stable measurement system. The thermocouple is susceptible to measurement error and requires frequent calibration. The calibration process is of the entire solution; this step requires either an on-site visit by a technician or complete removal and replacement of the monitor and probe. When the certification period is expired for the RTD, the probe is exchanged with minimal impact.
Data collection
An artifact of the technology at the time, the CDC guidance, recommends a 30-minute sample rate. With no storage limitation, is the 30-minute sample rate optimal? To determine if the sample rate is optimized, it is necessary to oversample the temperature change of a typical storage unit. The raw data from several refrigerator and freezer examples were analyzed using a Fourier analysis algorithm. An average of a 10-minute sample interval was determined from this analysis. A five-minute sample interval is the recommended monitoring interval to ensure an accurate representation of the storage unit performance. Utilizing a 30-minute sample interval can and will result in lost data, i.e., possibly missing excursions, which would result in damaging the stored contents.
Data presentation
Bloomberg reported that United Parcel Service Inc. is building two giant freezer farms capable of super-cooling millions of vials of a COVID-19 vaccine, preparing for the day when it will need to deliver the medicine at high speed across the globe.
The facilities, under construction in Louisville, Kentucky, and the Netherlands, near UPS air hubs, housing a total of 600 deepfreezers that can each hold 48,000 vials of vaccine at temperatures as low as -80 Celsius (-112 Fahrenheit) [16].
Newly purchased freezers areas susceptible to failure as one that has been in service for some time. Modern-day analytics built into today's monitoring solution can not only determine the consistency at which the goods are stored, but can also monitor the performance of the freezer. In these cases, the monitoring solution provides alert notifications not only for a temperature excursion but also predictive analytics alerting the user of a potential failure.
Even in a facility with as few as ten refrigerators/freezers, it would be nearly impossible to monitor each manually accurately. Employing a monitoring solution in which the user can observe the monitoring conditions at a glance is essential [18-22].
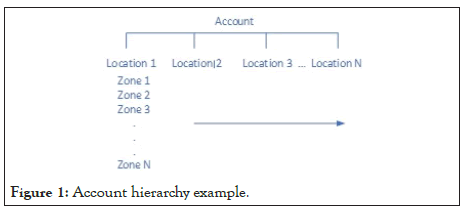
The viewing hierarchy can be established to meet the customer's requirements. Below is an example of the Account/Location/Zone structure. An Administrator role may be allowed to view the entire entity, where a Super User with the responsibility of only a portion has less, and a User may be designated with only a small number of zones in which they are responsible.
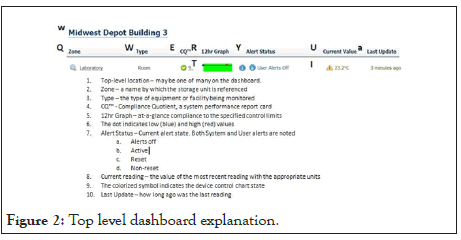
With a web based display solution, the users may access the portal data from any device. These include PC, Laptop, or mobile devices. The same hierarchy noted above for view access is configurable for alert notification. The alert notification process is explained in the following section of this manuscript (Figure 1 and 2).
Figure 1: Account hierarchy example.
Figure 2: Top level dashboard explanation.
Below is a snapshot of a monitoring facility dashboard; the components are noted below:
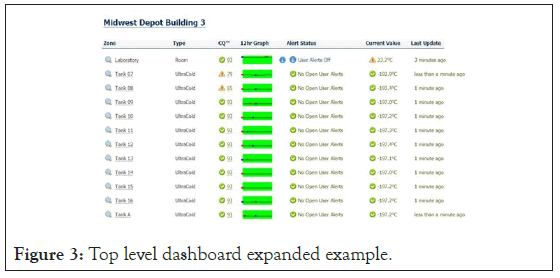
Figure 3 is an example of an active facility dashboard displaying several storage units being monitored. This graphic demonstrates the ability to display one to many locations to zones, in this case. In a single view, a user with the necessary granted permissions can view an entire entity in a single pane. The dashboard is color-coded to enable the user to note any deviations outside of the control limits quickly.
Figure 3: Top level dashboard expanded example
Alerting
Data capture and reporting in the cloud allows the computing power to detect and process the alert notification. The client is notified of an out of control limit condition through alerting. Alert notifications are based on several conditions. The duration of the monitored condition is out of tolerance. Other possible conditions include:
• Low battery
• No AC
• Loss of connectivity to the cloud
• Open/Short probe
• Missing probe
The VFC program's data logger notifies the user of an alert condition by a visual indication on the device or display. In some cases, an audible alarm is utilized. Both these methods require the user to be present and aware of being notified. In this age of low-cost cellular communication, an alert notification can include any of the following message and notification medium:
Pharma Watch STAFF USER ALERT
Med Clinic: Boise-Cole Road: Helmer
Temperature is at 3.3°C running critically above the alert limit of 3.1°C
Detected Wed, 12 Aug. 2020 09:11
This email was generated Wed, 12 Aug. 2020 09:11.
• Email notification
• SMS (Text)
• Voice
The alert notifications can be sent to an unlimited number of registered users on the system. Each has the ability to process the alert in any of its four steps.
• Acknowledgment-this step stops the alert notifications
• Reset-once the alert condition is resolved, this step allows alerting
• Documentation – allows the user to record the cause and resolution permanently
• Close – completes the alert process
Temperature buffer options
It is common in the cold chain monitoring of pharmaceuticals, vaccines, tissue, and other temperature-sensitive materials to require a temperature buffer consisting of a physical container into which the temperature probe is inserted. At the time of authoring this paper, there is no recommended or standard procedure for selecting this buffer. The specifics of the physical buffer size, shape, and material are very rarely chosen consciously but established by default to whatever the company providing the temperature probe uses. A review of physical, thermal buffers currently offered by these companies shows little consistency in any of these parameters. Volumes can range from 10 to 300 ml glycol vials, as well as machined and preformed blocks of aluminum, plastic, or silicone. The Centers for Disease Control and Prevention recommends a 20 ml Boston Bottle filled with an equal amount of water and glycol. The purpose of the water/glycol mixture is to prevent the freezing of the buffering solution. However, the stored goods monitored by this buffer were observed to include prefilled syringes as small as 0.25 ml to bottles and vials many times that volume [23-27].
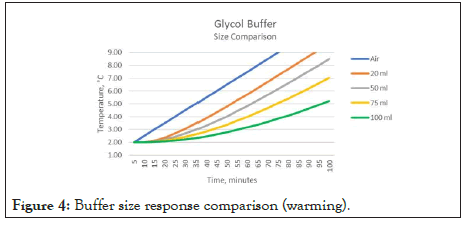
The two purposes of the buffered temperature probe are somewhat in opposition to each other. A larger volume buffer prevents "false" alerting from transient changes caused by regular use; however, that same buffer may fail to respond quickly enough to freezing or warming events in time to prevent spoilage of the storage unit's contents. Both objectives can only be achieved when the buffer is thermally matched to the stored goods.
Figure 4 demonstrates the result of applying different volumes of glycol buffers to the same warming data. In this case, the warming of the refrigerator is shown (fault condition – door ajar). The difference between a 20 ml and 50 ml buffer reaching the 8.0-degree level is 15 minutes. For a 100 ml buffer, this difference is 60 minutes. Accurate buffer sizing is critical when associating the measured temperature to that of the stored good. A similar observation is made when examining the same parameter for cooling conditions.
Figure 4: Buffer size response comparison (warming).
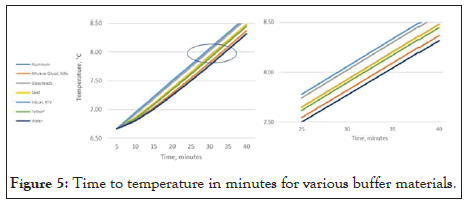
Figure 5 below demonstrates the effect of the selection of common buffer materials. In this presentation, the volume of the buffer remains constant, while the content is changed. In each case, a 20 ml volume of material is chosen. Aside from glycol, the results indicate that none of the selected buffer materials accurately represent the stored goods. To accurately represent the stored good, one must increase the size of each of the other buffers to match the characteristics of the stored good. [Rusnack, Accurate Temperature Representation of Stored Goods Using an Algorithm as a Replacement for a Physical Buffer 2018].
Figure 5: Time to temperature in minutes for various buffer materials.
The geometry and material utilized for a physical buffer are critical to the accurate representation of the stored content. Additional consideration must be given when the storage temperatures are for deep-frozen storage: -80°C (-112°F) or even -180°C (-292°F). Paraffin wax is suggested as buffer material; this, too, does not strictly represent the content being monitored.
The selection of the thermal buffer that is used in the monitoring of temperature-sensitive materials should not be simply left to the provider of the monitor system. It should be accomplished with great care and an understanding of the desired outcome. The following should be considered in the selection process:
• What are the physical properties of the materials being stored?
• What is the range of package sizes being stored?
• What is the buffer material selected as the buffer?
Knowing these three factors, one can adequately size the buffer that will accurately represent the temperature of the stored goods while providing valid and timely notification in the event of a temperature excursion.
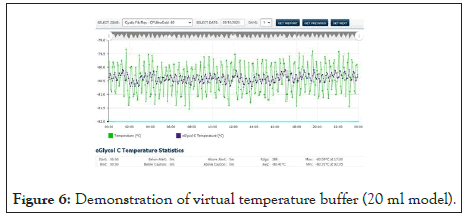
In those situations where the stored goods are packaged in a variety of enclosures, or when they may vary from time to time, it is ultimately impossible to accomplish this. The option of Virtual Temperature Buffering (VTB) could be the best solution to these situations. VTB is an algorithm with the ability to model the stored good based on the air temperature [28].
Figure 6 above exhibits the result of the algorithmic buffer. The buffer being simulated in this case is 20 ml Boston Bottle geometry. With VTB, the air temperature remains unchanged and available for further processing while presenting the buffered value. Any geometry and contents can be modeled.
Figure 6: Demonstration of virtual temperature buffer (20 ml model).
Metrics, objective and subjective
Data capture and reporting in the cloud allows performing data analytics on the gathered numbers. The simplest noted above, alerting when the measured value exceeds a predetermined threshold. Given the computing power available in the cloud servers, these complex computations may be accomplished with no impact on the data gathering process [29,30].
Numerous reports and summaries are available based on the raw data collected. These reports may be necessary for regulatory compliance, maintenance records, or storage solution performance reports.
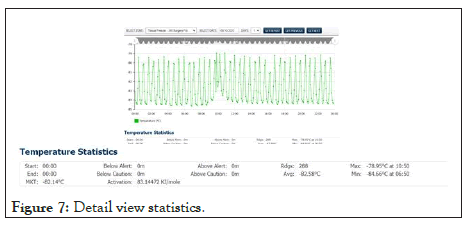
Shown in Figure 7 below, a view of the days measured data from a freezer with the summary statistics displayed below (see expanded window). The duration of any excursion above and below the control limits, as well as average, minimum, and maxim values recorded, are available to the user for the selected period. Also accessible is the Mean Kinetic Temperature (MKT) value for that period. The activation energy is programmable where needed. The MKT will aid the end-user in determining the potency of the product in the event of temperature excursions.
Figure 7: Detail view statistics.
The data collected as part of the monitoring solution contains a wealth of information that is ready for harvesting. Compliance with agency regulations can be reactive or proactive. A reactive response would be one that is following the methodologies outlined for proper and accurate monitoring and only responds when alerted or otherwise notified. In contrast, proactive compliance would employ data analytics that provides the user with methods by which monitoring and management of the collected storage data may be accomplished. These methods would show strengths and weaknesses in the monitoring and management of the overall compliance, thus allowing the user to focus on addressing any potential liability and preventing loss due to non-compliance [31-35].
There are two primary contributors to potential non-compliance human and machine. The human, in this case, refers to the user meeting the specifics of the regulations in the mandated periodic data viewing and recordation, alert management, and documentation. The machine factors include the external environment, i.e., energy supply (AC Power), storage unit operation, and performance, to name a few. Each of these factors contributes to the regulatory compliance in part and as an aggregate.
By recording and displaying the users to perform the necessary and mandated documentation, any necessary and appropriate training can be implemented, for example. Albeit a small step, results in adherence to regulatory guidance and better performance statistics. Similarly, machine performance can be measured and displayed. Predictive analytics may be utilized to monitor the storage unit. From this information, preventative maintenance may be cited to address an issue before It becomes serious. In the event of a power failure, the system can be designed to alert the user with sufficient time to prevent spoilage of the stored goods.
In quality improvement, managing data is an essential part of performance improvement. It involves collecting, tracking, analyzing, interpreting, and acting on an organization's data. Data management also includes ongoing measurement and monitoring. It is thus enabling an organization to identify and implement opportunities for improvements to the current process.
Results
The cold chain distribution process is the next step of the good manufacturing practice (GMP) environment that all drugs and biological products that are required to adhere to health regulatory bodies. As such, the distribution process must be validated to ensure that there is no negative impact on the safety, efficacy, or quality of the vaccine in this case. The extension of the GMP environment requires that all processes that might impact the safety, effectiveness, or quality of the vaccine must be validated, including the transportation, storage, and distribution of the vaccine.
A failure of any point in the cold chain distribution process may result in the compromise vaccine. Without continuous and accurate monitoring throughout the process, a portion of the vaccine being distributed may become ineffective. When this occurs, there are consequences that may not be realized until well after the vaccine is distributed and utilized. The observed consequence is a breakout of a cluster of vaccine-preventable illness.
UPS is building two facilities for the storage of the COVID vaccine. Each of the 600 freezers will store 48,000 vials of vaccine. The undetected failure of a single freezer can result in the distribution of ineffective vaccines to a population the size of a small city, which could lead to the vaccine not being effective.
Confidence in the efficacy of the COVID vaccine is paramount. Present-day, confidence in the routine childhood vaccinations are already shaken. An incident, as described above, will only delay the need for a high percentage of vaccinating the public.
Conclusion
The cold chain includes the following "links":
• Transport from manufacturing facility to storage facility
• Warehousing of the vaccine in the storage facility
• Transport from the warehouse to localized distribution centers
• Storing of vaccines in preparation for distribution to clinics
• Transport from local distribution center to clinics
• Maintaining vaccines at clinics
• Transport and use at off-site (i.e., mobile clinics)
A break in any link of the above chain can result in the diminution of the stored vaccine. Responsibility for the supply chain monitoring will require continuity at all stages of the process. In the above scenario, the responsibility for the vaccine is broken into two entities. An example of this would be UPS obtaining, storing, and distributing the vaccines to a major hospital provider that will, in turn, distribute the vaccine to community clinics. The community clinics may vaccinate their facility or offer an outreach program where the vaccines are transported and stored at a one-day clinic.
Cellular based (IoT) monitoring devices provide a unique opportunity to monitor the COVID vaccine cold chain. With no need to connect to a Wi-Fi network, the system is plug and play. Recordation of each shipment is associated with the temperature data experienced by the contents of the container. The ongoing storage at the freezer farm is monitored 24 × 7 providing the assurance that any equipment failure, environmental anomaly, or human intervention is detected well before the vaccine is compromised. Real-time, end to end monitoring may be accomplished during transport, storage, and distribution. The raw temperature data can be analyzed, providing all forms of analytics, quality measures, and reports.
Not unlike the above, the second phase of custody is monitored from a single dashboard. The hospital facility is able to maintain a close view of all storage facilities throughout its network. All of this ensures the safe and efficacious distribution of the COVID vaccine.
The solution described draws its parallels with the Vaccine for Children's program while advancing the use case and technology to the best available of 2020. It is important to note that a preponderance of the VFC products is maintained at 2 to 8°C (35 to 46°F) during storage and transport. The leading candidates for the COVID vaccine will require deep-frozen storage: -80°C (-112°F) or even -180°C (-292°F), a completely different measurement system than that utilized for the VFC program.
Conflicts of Interest
The author of this manuscript on COVID vaccine transportation, Storage, and Distribution, Michael Rusnack, has not received grants, speaker’s fees, etc., from any trade body within the past two years. The author has no potential conflicts.
REFERENCES
- Aldous J. How to select a thermal buffer from glycol, sand, glass beads, or Solid material blocks. Temperature probe buffer types for pharmaceutical & biotech temperature monitoring applications. 2017.
- Averall, Kasia. Cell and gene therapies & thier GMP requiremnts. ISPE. 2019.
- Bello, Juan. What is Cat-M1 and What does it mean for IoT? DZone. 2016.
- Canada, Government of Guidelines for temperature control of drug products. 2011.
- CDC. N.D. Historical Vaccine Safety Concerns. Vaccine Safety. 2020.
- Vaccine Storage and Handling. Epidemiology adn prevention of vaccine preventable diseases. 2020.
- Vaccine Storage and Handling Tookkit. 2020.
- Chatterji, Saubjadra. Govt plans to build cold storage, supply chain for COVID-19 Vaccines. Hindustan Times, 2020.
- Chouffani, Reda. Future of IoT in healthcare brouight into sharp focus. IoT Agenda. 2020.
- Florida Department of Health. Vaccines for children (VFC) Program policy handbook. Florida Department of Health-Immunication Section. 2020.
- Griffen, Riley and Koons, Cyntia. Sanofi Partner Takes On Vaccine Hurdle: -112 Degree Storage. Bloomberg Law. 2020.
- Health Protection Scotland. Guidance on vaccine storage and handling. National Services Scotland. 2017.
- Holuj, Brian and Hagelberg, Niklas. n.d. Why optimized cold-chains could save a billion COVID vaccines. United Nations Environment Programme. 2020.
- Horton, Emily. Lloyds of London gives green light to COVID-19 vaccine Insurance. Financial News. 2020.
- Hunt, Rhian. UPS builds large freezer farms in preparation for COVID-19 vaccine shipments. The Motley Fool. 2020.
- Islam, Mazharui and Marma, Mono. Evolution of vaccinology and vaccines for COVID-19: Where do we stand now? Dhaka Tribune. 2020.
- Julia Borgini, Spacebarpress Media. Overcome 5 IoT device management challenges. TechTarget-IoT Agenda. 2020.
- Julie Steenhuysen, Kate Kelland. Vaccine makers face biggest medical manufacturing challenge in history. Business News. 2020.
- Leffert, Catherine. UPS readies freezer farms to ship virus vaccine-If We Get One. Bloomberg – Prognosis. 2020.
- Microsoft. What is Cloud Computing?. 2020.
- NIST. N.D. Reliable vaccine storage. Industry Impacts. 2020.
- Now, freezer farms for potential COVID-19 vaccine delivery. Pharmaceutical Commerce. 2020.
- Professionals, Canada Health. Guidance for immunization priorities during COVID-19. 2020.
- Report, WHO-Technical. Temperature and humidity monitoring systems for transport operations. Geneva. 2014.
- Rusnack, Michael. Accurate temperature representation of stored goods using an algorithm as a replacement for a physical buffer. NCSL International. 2018.
- Misuse and Misconceptions of Physical Temperature Buffering. NCSL International. 2019.
- Simpkins, Kelsey. Why developing a successful COVID-19 vaccine only half the battle. CU Bolder Today. 2020.
- Spiro, Tropher and Emanuel, Zeke. Center for American Progress. A comprehensive COVID-19 vaccine Plan. 2020.
- Technopedia. Internet of Things (IoT). 2019.
- The College of Physicians of Philidelphia. The future of immunization. The History of Vaccines. 2018.
- Vaccines for Pandemic Threats. The History of Vaccines. 2018.
- Vaccine Timeline. Immuinzation Timeline. 2020.
- WHO. Chapter 2-The Vaccine Cold Chain. 2020.
- WHO. Temperature and humidity monitoring systems for transport operations. Geneva: WHO Technical Report Series. 2014.
- Zhang, Sarah. A Vaccine reality check. The Atlantic. 2020.
Citation: Rusnack M (2020) COVID Vaccine Transport, Storage, and Distribution: Cold Chain Management to Ensure Efficacy. J Vaccines Vaccin. S4:001. DOI: 10.35248/2157-7560.20.S4.001
Copyright: © 2020 Rusnack M. This is an open-access article distributed under the terms of the Creative Commons Attribution License, which permits unrestricted use, distribution, and reproduction in any medium, provided the original author and source are credited.
