


Indexed In
- Open J Gate
- Genamics JournalSeek
- JournalTOCs
- China National Knowledge Infrastructure (CNKI)
- Electronic Journals Library
- RefSeek
- Hamdard University
- EBSCO A-Z
- OCLC- WorldCat
- SWB online catalog
- Virtual Library of Biology (vifabio)
- Publons
- MIAR
- Euro Pub
- Google Scholar
Useful Links
Share This Page
Journal Flyer

Open Access Journals
- Agri and Aquaculture
- Biochemistry
- Bioinformatics & Systems Biology
- Business & Management
- Chemistry
- Clinical Sciences
- Engineering
- Food & Nutrition
- General Science
- Genetics & Molecular Biology
- Immunology & Microbiology
- Medical Sciences
- Neuroscience & Psychology
- Nursing & Health Care
- Pharmaceutical Sciences
Brief Report - (2023) Volume 14, Issue 1
Construction of a Gas Pipeline from Valve Terminal to a Nearby Power Station
Muhammad Towhidul Islam*Received: 16-Feb-2023, Manuscript No. JPEB-23-19957; Editor assigned: 20-Feb-2023, Pre QC No. JPEB-23-19957 (PQ); Reviewed: 06-Mar-2023, QC No. JPEB-23-19957; Revised: 13-Mar-2023, Manuscript No. JPEB-23-19957 (R); Published: 21-Mar-2023, DOI: 10.35248/2157-7463.23.14.502
Abstract
The feasibility of constructing a natural gas pipeline from the Ashugonj valve station to the Zia Fertilizer Company Limited (ZFCL) is investigated in great depth in this report.
Further, it conducts a feasibility study on a potential new pipeline to a hypothetical 1000 Megawatt (MW) power plant located about 0.5 km from Himachal Futuristic Communications Limited (ZFCL).
Energy consumption is on the rise; hence the planned pipeline needs to be able to transmit 1500 MMSCFD (Million Standard Cubic Feet per Day) of natural gas.
Along the proposed road from Ashugonj VS 3 to ZFCL, it appears that a number of pipeline facilities already exist; these are taken into account in order to keep prices down.
Therefore, the study is centered on building a pipeline that is half a kilometer in length to get to the power plant.
The technical and economic correctness of the study was evaluated by analyzing the expected financial condition for the next 20 years.
As part of our evaluation of the projects' reliability, we conducted a comprehensive sensitivity analysis.
According to the aforementioned assessment, the project can meet current energy needs while also being profitable in the long run.
Keywords
Gas pipeline; Zia fertilizer; Environment; Petroleum engineering
INTRODUCTION
There is a pipeline that is 3.5 kilometers long and has a 10 inch diameter that runs from the Ashugonj valve station to the Zia Fertilizer Factory. Following in-depth research and analysis, it was concluded that the Ashugonj region of Bangladesh will require the construction of a power plant with a capacity of one thousand Megawatts (MW) during the next twenty years [1]. If this is the case, will the capacity of the pipeline be sufficient to meet the ever- increasing demand?
• In the event that this is not possible, which pipeline design and foundation will be recommended?
The daily gas flow through the pipeline Q=175 MMSCFD, as stated by the information that was provided by Titas Gas Transmission and Distribution Company Limited (TGTDCL). However, if an additional 30% is added (as per the protocol for the pipeline), the daily gas flow is closer to 230 MMSCFD [2].
According to the 728 MW power plants in Ashugonj, if we build a 1000 MW power plant 500 meters from Ashugonj ZFCL, it will consume approximately 850 MMSCFD of gas per day. If we design a pipeline based on adding 30% more over the next 20 years, the total amount of gas that will be required per day will be 1100 MMSCFD [3].
It is clear from the current situation that the pipeline cannot keep up with the escalating demand 230 ≤ Q<1100
Fundamentally, there are two possible solutions to this problem, and we will choose the one that will cost us the least while still giving a solid solution.
They are as follows:
• Pipeline in series
• Parallel pipelines
Methodology
A review of the current situation regarding the need for power in Bangladesh,
An analysis of the anticipated demand for power production, as well as the supply,
Developing a plan for the construction of a pipeline to transport natural gas to that region. A cost-benefit study of the proposed pipeline construction will be carried out [4].
Analysis annual report issued by the Bangladesh Power Development Board (BPDB) for the years 2008-2009 [5].
We are able to make educated guesses about the installed capacity, generation capability, and demand augmentation in the not too distant future. At the prices that are currently in effect, the annual increase in electricity demand has been approximately 10% on average. This indicates that an annual addition of 500 MW of new generation capacity is required only to keep up with the growth in demand (Figure. 1) [6].

Figure 1: Analysis annual report issued by the Bangladesh Power Development Board (BPDB).
Note : ( )Installed Capacity, (
 ) Generation Capability, (
 ) Demand Forecast
Design calcualtion
For trnsporating a given quantity of gas at a given pressure drop, length is proportional to diameter raised to the power 16/3.

The series line shown has a total equivalent length of,
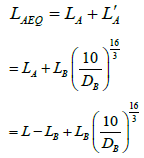
The modified panhandle (panhandle B) equation –Horizontal flow,
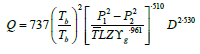
Combining the equivalent length equation and modified panhandle equation for horizontal flow and putting necessary data we get the following equation,
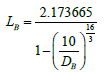
Putting different value of DB in this equation we get the following Table. 1,
| DB (inches) | LB (miles) |
|---|---|
| 11 | 5.4544 |
| 12 | 3.4955 |
| 13 | 2.8857 |
| 14 | 2.6068 |
| 15 | 2.4561 |
| 16 | 2.3665 |
| 17 | 2.3099 |
| 18 | 2.2724 |
| 19 | 2.2468 |
| 20 | 2.2288 |
| 21 | 2.2159 |
| 22 | 2.2065 |
| 23 | 2.1995 |
| 24 | 2.1941 |
| 25 | 2.1901 |
| 26 | 2.187 |
| 27 | 2.1845 |
| 28 | 2.1826 |
| 29 | 2.181 |
| 30 | 2.1798 |
| 31 | 2.1788 |
| 32 | 2.178 |
| 33 | 2.1773 |
| 34 | 2.1768 |
Table 1: Pipeline diameter in respect of length
The series pipeline is not going to work with the demand that we have proposed for the pipeline.
So, for instance, if we chose to series 2.1941 miles of pipeline with a diameter of 24 inches, the remained of the pipeline will be 1.3059 miles, which is current pipe with a diameter of 10 inches, and this pipe will not be able to sustainably fulfill the entire demand.
As a result, we are going to construct the looping pipeline.
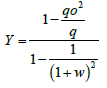
When, Y=100% we get DB= 19.16 inches
When, Y=98% we get DB= 30 inches diameter pipe, we will use this 30 inches in our proposed pipeline.
To calculate pipe wall thickness, following formula is used.
t = DP / 2YFLJT
t=Pipe wall thickness in mm
P=Design Pressure in Psig=960 psig
D=Outside diameter of pipe in inch=30in
Y=Minimum Yield Strength in Psig=60,000 psig (Assume API 5LX 60 Grade Steel Pipe)
F=Design Factor=0.8
L=Location Factor, it depends on the route of the pipeline. For the cross country pipeline this factor to 0.6
T=Temperature Derating factor=1 for temperature up to 2500 F
J=Joint Factor, J=1
Therefore using equation 3.6 we get, t=12.7 mm
Assume, corrosion allowance for steel pipe=2 mm
Hence Pipe wall thickness=(12.7+2) mm=14.7 mm
Compare this calculated pipe wall thickness to API 5L line Chart we get wall thickness from API chart=12.7 mm [2].
Result and Discussion
Cost estimation
After it has been determined that a project does not have any technical flaws, the following stage is to analyze whether or not it is financially viable. The profitability analysis, efficiency analysis, effectiveness analysis, cost effectiveness analysis, and sustainability analysis are all covered in the financial analysis of the development project [7].
To ensure that there is a financial plan that will make finances available to accomplish the project on schedule is an important component of the financial appraisal that must be performed. (Financial analysis 2000-2001, planning dept. of titas T&D Co. ltd.) [3].
NPV=32789.589
BCR=877.469
IRR=35%
From Table 2.
| Year | Investment cost(million taka) | Operating cost(million taka) | Total cost(million taka) | Total revenue(million taka) | Net income(million taka) | Discount factor 15% | Discounted total cost(million taka) | Discounted total revenue(million taka) |
|---|---|---|---|---|---|---|---|---|
| 2010 | 34.2287 | - | 34.2287 | - | -34.2287 | 1 | 34.2287 | - |
| 1 | - | 0.51343 | 0.51343 | 1455 | 1454.48 | 0.870 | 0.4466 | 1265 |
| 2 | - | 0.51343 | 0.51343 | 3147 | 3146.49 | 0.756 | 0.3881 | 2379 |
| 3 | - | 0.51343 | 0.51343 | 3467 | 3466.49 | 0.658 | 0.3378 | 2281 |
| 4 | - | 0.51343 | 0.51343 | 3823 | 3822.49 | 0.572 | 0.2937 | 2186 |
| 5 | - | 0.51343 | 0.51343 | 4215 | 4214.49 | 0.497 | 0.2552 | 2094 |
| 6 | - | 0.51343 | 0.51343 | 4648 | 4647.49 | 0.432 | 0.2218 | 2007 |
| 7 | - | 0.51343 | 0.51343 | 5124 | 5123.49 | 0.376 | 0.1930 | 1926 |
| 8 | - | 0.51343 | 0.51343 | 5649 | 5648.49 | 0.327 | 0.1679 | 1847 |
| 9 | - | 0.51343 | 0.51343 | 6228 | 6227.49 | 0.284 | 0.1458 | 1768 |
| 10 | - | 0.51343 | 0.51343 | 6867 | 6866.49 | 0.247 | 0.1268 | 1696 |
| 11 | - | 0.51343 | 0.51343 | 7572 | 7571.49 | 0.215 | 0.1103 | 1627 |
| 12 | - | 0.51343 | 0.51343 | 8348 | 8347.49 | 0.187 | 0.0960 | 1561 |
| 13 | - | 0.51343 | 0.51343 | 9203 | 9202.49 | 0.163 | 0.0837 | 1500 |
| 14 | - | 0.51343 | 0.51343 | 10148 | 10147.49 | 0.141 | 0.0724 | 1430 |
| 15 | - | 0.51343 | 0.51343 | 11186 | 11185.49 | 0.123 | 0.0632 | 1196 |
| 16 | - | 0.51343 | 0.51343 | 12334 | 12333.49 | 0.107 | 0.0549 | 1319 |
| 17 | - | 0.51343 | 0.51343 | 13598 | 13597.49 | 0.093 | 0.0477 | 1264 |
| 18 | - | 0.51343 | 0.51343 | 14993 | 14992.49 | 0.081 | 0.0416 | 1214 |
| 19 | - | 0.51343 | 0.51343 | 16526 | 16525.49 | 0.070 | 0.0359 | 1156 |
| 2030 | - | 0.51343 | 0.51343 | 18223 | 18222.49 | 0.061 | 0.0313 | 1111 |
| Total =34.2287 | 37.411 | 32827 | ||||||
Table 2: Calculation of Financial Value of NPV, BCR, IRR
Note
• Land acquisition and requisition cost have been calculated in the basis of actual cost of Nalka-Bogra project and the quality of land has been fixed as bare minimum base on the Natural Gas Safety rule 1991 amended on 2003
• Land development cost has been prepared in the basis of Public Works Department (PWD) standard and rate as on 2004
• Accommodation area and Estimated cost for civil construction works have been prepared on the
• basis of Public Works Department (PWD) standard and rate as on 2004
• Cost of machinery and equipment has been calculated on the basis of proportionate value of actual cost of being implemented Nalka-bogra, Ashuganf-Monohordi project
• LC= Local Price, FC=Foreign Price, Conversion rate 1 US$=70.02Tk. [8]
Conclusion
The project's goals were to build a new pipeline that would replace the existing one in order to supply gas flow at the projected pressure and volume. This would need the construction of a new pipeline. Just 225 MMSCFD of gas can be transported at this time through the pipeline that is currently in place, and even that amount is rapidly diminishing as the demand for gas increases along the pipeline's path. If the proposed pipeline is constructed, it could be capable of capacity to transport around 1100 MMSCFD of gas on a daily basis. At the moment, supply and demand are almost pretty balanced. In order to satisfy the ever-increasing demand in the years to come, the provision really needs to expand. The entire cost of the project is going to be 342.287 lakh taka. In order to conduct a profitableness analysis, a number of technical assessments such as Net Present Value (NPV), Benefit-Cost Ratio (BCR), Internal Rate of Return (IRR), and Environmental Impact Assessment (EIA) are carried out.
References
- Kennedy JL, Oil & Gas pipeline fundamentals; 1993.
- McAllister EW. Pipeline rules of thumb handbook: a manual of quick, accurate solutions to everyday pipeline engineering problems. Gulf Profe Publish; 2013.
- Nazimuzzaman M. Network analysis and design of natural gas distribution in Narshingdi. 2006.
- ASME Code for Pressure Piping, B-31: Pipeline Transportation System for Liquid Hydrocarbon and other Liquids.
- Ahiduzzaman MD, Islam AS. Greenhouse gas emission and renewable energy sources for sustainable development in Bangladesh. Renewable and Sustainable Energy Reviews. 2011;15(9):4659-4666.
- Bangladesh Roadmap for Energy Efficiency Improvements and Demand Side Management. Dhaka.2009.
- Hydrocarbon Unit (HCU)-NPD (2002): Joint Study of “Bangladesh Petroleum potential and Resources Assessment”.
- Sanwar Hossain M. Feasibility study of gas supply to Rajshahi. 2007.
Citation: Islam MT (2023) Construction of a Gas Pipeline from Valve Terminal to a Nearby Power Station. J Pet Environ Biotechnol. 14:502
Copyright: © 2023 Islam MT. This is an open-access article distributed under the terms of the Creative Commons Attribution License, which permits unrestricted use, distribution, and reproduction in any medium, provided the original author and source are credited.