


Indexed In
- Open J Gate
- RefSeek
- Hamdard University
- EBSCO A-Z
- OCLC- WorldCat
- Publons
- International Scientific Indexing
- Euro Pub
- Google Scholar
Useful Links
Share This Page
Journal Flyer

Open Access Journals
- Agri and Aquaculture
- Biochemistry
- Bioinformatics & Systems Biology
- Business & Management
- Chemistry
- Clinical Sciences
- Engineering
- Food & Nutrition
- General Science
- Genetics & Molecular Biology
- Immunology & Microbiology
- Medical Sciences
- Neuroscience & Psychology
- Nursing & Health Care
- Pharmaceutical Sciences
Research Article - (2020) Volume 9, Issue 3
Complementarity of Optical Remote Sensing and Geographic Information System for Detection and Mapping of Geological Lineaments: A Case Study in the Metlaoui Region in Southern Tunisia
Aliouet S1, Soudani K2*, Melki F3 and Ahmed B12Laboratory of Systematic Ecology and Evolution, CNRS, University of Paris Sud, Orsay, France
3Laboratory Geomatics, Structural and Applied Geology, University Tunis El Manar, Tunisia
Received: 16-Jul-2020 Published: 06-Aug-2020, DOI: 10.35248/2469-4134.20.9.277
Abstract
This study focuses on the region of Metlaoui (Southern Tunisia) where the marks of a neotectonic activity are spectacular. The main objectives are the detection and the mapping of the network of fractures at this region. Different techniques of automatic extraction of lineaments based on remote sensing images acquired from Landsat-7 ETM and Aster satellites were applied. The results obtained from this satellite-based approach were compared with the results from two independent approaches based on the interpretation of aerial photographs and the exploitation of topographic maps. Major lineament groups were described based on the shapes, orientation and lengths. The most prevalent groups are those oriented along the following axes: NE-S; NW-SE; NNE-SSW; E-W; and N-S. The most common are the lineaments oriented following NW-SE and E-W directions, which reflect the passage of the wellknown directional fault of Metlaoui. Combining information from satellite images, aerial photographs, topographic and geologic maps, accompanied with in-depth validation from field campaigns allowed the accurate detection of the tectonic accidents at high spatial resolution over the whole studied region. A new map of lineaments has been established. Its use to update the geological map of the Metlaoui region is in progress.
Keywords
Lineaments; ASTER; Landsat-7 ETM; Neotectonic; Faults; MetlaouiIntroduction
In general terms, a lineament is a Latin word "Linea"=line. According to several authors [1-11], it corresponds to a general rectilinear feature"; straight or slightly curved lines; that differs distinctly from the patterns of adjacent features.
The mapping approach of fracture networks is a key tool for the study of regional tectonics and morpho-related arrangement of the geomorphological landscape. With the aim of identifying and mapping lineaments and morphometric structures, the complementarity between the automatic extraction methods from remote sensing images, optical passive and active radar, and the usual methods based on the interpretation of topographic and geological maps, and aerial photographs has been successfully used in many works [12-22]. As examples, in the High Moroccan Atlas, Himyari et al. applied different directional filtering techniques to detect lineament features based on HRV (XS) SPOT images and found results consistent with those obtained in the geological map. Songmuanget al. have demonstrated the usefulness of remote sensing images based on the exploitation of Landsat imagery and the interpretation of aerial photographs for the detection of active faults in the Sri Sawat region (Western Thailand). Youan Taet al. combined remote sensing techniques based on Sobel and gradient filters applied on Landsat-7 ETM+imagery and geostatistics to map fracture networks in the Bondoukouregion (North-East of Ivory Coast. Other studies [21,23-30] have highlighted the strong potential of the radar remote sensing to determine lineaments even those non-detectable in aerial photographs or in optical remote sensing images.
However, all these studies and whether the sources used are aerial photographs, optical or radar images, show that the automatic extraction methods of lineaments lead to confusion because these methods do not only detect lineaments of geological origin but also any other form of linear structure such as field boundaries, crop rows, roads, water flow paths, etc. This is particularly the case in arid regions, such as the Southern Tunisia and other North African regions, where soils, usually uncovered, are strongly eroded along water flow paths.
But from a methodological point of view, these regions are also interesting to evaluate the use of remote sensing for geological purposes because they are not covered by dense vegetation that may totally of partially hide geological structures.
However, as underlined above, the risk of confusion between the lineaments of geological origin and those caused by other natural or anthropogenic factors is very high and the dissipation of this confusion is only possible by relying on detailed knowledge of the study region and cross-checking the results obtained from remote sensing techniques against information gathered from other sources such as field campaigns, geological and topographic maps and aerial photography interpretation.
The region of Metlaoui, located in Southwestern Tunisia, is characterized by numerous tectonic faults and is one of the beststudied and documented regions of Tunisia [14,22,31-47].
As far as we know, with the exception of a very few studies [14,22] no other studies have been conducted in this region with the primary objective to evaluate the use of remote sensing imagery for mapping geological lineaments. This study aims to meet this objective. The approach used is a multi-sources, based on the complementarity of GIS and remote sensing, where information extracted from remote sensing images are validated in-depth based on data collected in several previous studies and from numerous field campaigns.
Materials and Methods
Study area
The study area is located in the South-West of Tunisia (Figure 1). It belongs to the arid area characterized by an almost total lack of vegetation except some kinds of oasis (Segdoud and Chbikha regions). However, Oued FoumKhangua and Thelja constitute the two perennial streams in the study area thanks to water sources whose flows can vary according to the seasons.

Figure 1: Location of the study area (UTM coordinate system Z32 WGS 1984).
Maps and images used
Cartographic, photographic and satellite data used for mapping geological lineaments are presented in Table 1.
| Date | Date | Scale | Title |
|---|---|---|---|
| Topographic maps | 1957 et 1993 | 1/100000 and 1/50000 | Metlaoui and Gafsa |
| Geological maps | 1985 | 1/100000 | Metlaoui and Gafsa |
| Aerial photographs | 1952 | 1/100000 | Chain of Metlaoui |
| 1963 | 1/25000 | ||
| 1990 | 1/60000 | ||
| ASTER satellite image | 2000 | 15 m | Chain of Metlaoui |
| Landsat ETM+image | 2001 | 30 m | Chain of Metlaoui |
Table 1: Data used.
From a structural geology perspective, the beam of folds of the chain of Metlaoui (Figure 2) is affected by two major tectonic features of Southern Tunisia oriented according average directions between N120° to N130°: the Gafsa accident on the East and the fault of Chebika on the West [14,22,37,38,40,48].

Figure 2: Rifts setback GafsaChebika.
Satellite images and aerial photographs have been geometrically corrected. The corrected images and the topographic and geological maps were geo-referenced in the same coordinate system: UTM projection-Zone 32 – and WGS 84 ellipsoid reference under ENVI software (Exelis-Visual Information Solutions, USA). All these layers were held within a Geographical Information System (ArcGIS, ESRI, USA).
Methodology for data processing
The general methodology is illustrated in Figure 3. Data processing methods, data sources and field campaigns are reported.

Figure 3: Data Processing Flowchart.
Extraction of lineaments by convolution filters: The imagebased processing methods applied to remote sensing images in order to extract linear structures are based on the application of convolution filters [49]. These spatial filters are designed to bring out or hide specific characteristics of an image. Briefly, a filter is a moving window of size n2 (n is an odd positive integer, usually 3 or 5) which, when applied on the image, exaggerates or hides the contrast between the central pixel of the moving window and its neighbors according the previously defined weights (positive or negative real scalars). Applied to an image, these filters allow the detection of linear structures in the landscape that are radiometrically different from their immediate environment.
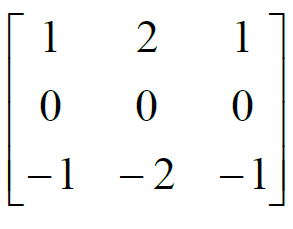
In this study, five filters are used and compared (Table 2).
| High Pass Filter | Sobel in (E-O) direction | Sobel in (N-S) direction | Roberts in (E-O) direction | Roberts in (N-S) direction |
|---|---|---|---|---|
 |
 |
 |
 |
 |
Table 2: Lineament detection filters Matrix
The high-pass filter is used to detect radiometric changes and edges. This is a filter that has the effect of suppressing low frequencies and keeps only the high frequencies by exaggerating the contrast between a pixel and its neighbors. Such a filter produces a more mixed picture than the original image but also noisier. The Roberts and Sobel filters belong to directional filtering techniques and are used to calculate the first derivative of the image over the moving window size and according East- West and North-South directions. The values of a given pixel in the filtered image correspond to the sum of local gradients calculated on both directions [50]. Consequently, these filtering techniques allow to detect lineaments vertically, horizontally and at 45° direction with respect to the gradient filter.
Field observations and measurements: Field campaigns across the entire study area were undertaken. They were made in several missions before and after the implementation of the remote sensing approach. They have served to:
Check the information gathered from previous studies in the same region or in the surrounding areas.
Verify and validate the presence of lineaments mapped based on the different data sources used in this study (topographic and geological maps, aerial photography and satellite imagery).
Record GPS locations of lineaments and measurements of their geometrical characteristics (direction, dip, pitch, value and direction of the slope). When the configuration is appropriate, measurements of fault displacements were performed.
Soil surface states (color, texture, roughness, etc.) were described and a database composed of pictures and collected information has been created. In addition, geological sections have been made to highlight the morpho-tectonic facies observed on the study site.
Certify and keep the lineaments having a structural and tectonic significance.The lineaments detected from the filtered images and on the cartographic and photographic layers, are systematically checked in the field before being retained. The spatial features likely to be confused with lineaments of geological origin such as linear objects of anthropogenic origin (roadways, railways, hydrographic networks, etc.) have been identified and eliminated from the analysis.
Gather all available data on the effect of neotectonics on the arrangement of the geomorphological landscape on the mountain and on the foothills of the study area.
Results
Mapping tectonic lineament structures from aerial photography, topographic and geologic maps
Mapping lineaments from topographic maps: On the topographic map and based on the methodology described in [51] for the detection of tectonic faults in Tunisia, it has been possible to highlight spatial alignments related to different geographical phenomena such as slope failure, flow lines, thalwegs and water sources (Figures 4a-4c). These lineaments are called probable lineaments in order to distinguish them from the lineaments retained after the validation process.

Figure 4: Lineaments related to various geographical phenomena. a)probable tectonic lineaments (red) along the flow lines and thalwegs (blue) based on the topography map (brown curves). b) probable tectonic lineaments (green) depending on the location of the water sources (blue points). c) probable tectonic lineaments following the slope failure (yellow line).
Mapping lineaments from aerial photographs: The photointerpretation of aerial photographs allowed to identify probable lineaments and to determine their lengths, orientations and relative age on the relief (Figure 5a) and on the foothill (Figure 5b) of the Metlaoui chain.

Figure 5: Lineaments identified from aerial photo-interpretation: a) on the foothill; b) on the relief.
Mapping lineaments from the geologic map: On the geological map, the information recorded and related to the tectonic structure are: the value and the direction of the dip, the faults that are already mentioned and probable, the flexures and the axes of the anticlinal and synclinal folds. Figure 6 shows the map of the geological outcrops developed during this study. This map allowed identifying the lithology of different stratigraphic units, to identify their characteristics and their spatial distribution. This map was also useful for distinguishing the nature and age of outcrops and identifying the alternation of hard and soft rocks. Among other things, this map has improved the geological interpretation of discontinuities in textures such as the contours of relatively homogeneous zones, which can reveal the presence of faults or fractures.

Figure 6: Lineaments from the geologic map.
Mapping lineaments using remote sensing data and filtering techniques
Lineament mapping structures is made from Landsat 7 ETM+ and ASTER images in order to map probable lineaments, whether geological or not. The techniques used include mainly filtering methods (Sobel, Roberts and high pass filters) applied on the red bands of ETM+ and ASTER due to the good soil detection in this wavelength. Then, the extraction of lineaments was achieved by visual interpretation of filtered bands. A large number of lineaments was detected. The mapping process was carried out manually in a vector layer created under a GIS software. The linear objects that are artificial (roads, railways) or natural (line flows, streams and rivers, etc.) are eliminated to keep only the lineaments having a “ structural geology ” significance. The results obtained are illustrated in Figures 7 and 8.

Figure 7: A subset of mapped lineaments detected from ASTER false color composite RGB image.

Figure 8: Subsets of lineaments mapped on filtered ASTER red image a) High pass filter; b) Sobel filter and c) Roberts filter.
Figure 8 Subsets of lineaments mapped on filtered ASTER red image a) High pass filter; b) Sobel filter and c) Roberts filter.
These results were systematically compared to results obtained based on the interpretation of aerial photographs and the exploitation of topographic and geologic maps. The lineaments that have been definitely retained result from an in-depth work of validation based on the superposition and the cross-checking of information obtained from the different maps given above, the previous studies and field observations. These lineaments correspond to tectonic accidents that are identified with certainty and they served to establish the final map lineaments on the study site.
Illustration from some examples of neotectonics of the study area
Among the lineaments of geological origin, detected in this study, the example of the Thelja river, shows spectacular neotectonics activity (Figure 9):

Figure 9: Pictures and sections of F1 fault (a), F2 (b) and F3 (c) in the area of the gorge of Thelja river (West of Metlaoui).
F1 fault (Figure 9a) located at the left bank of the river about 8 km West of the Metlaoui city, has a vertical offset of the order of 30 cm, with a mirror of average direction N30°, 60° E-SE with stria oriented downwards at 70° in the N-NE direction.
F2 fault (about 10 m of fault F1) is a mirror of average direction 30° N,45° E-SE with striae oriented downwards at 60° in N-NE direction. It follows the location of clay of the Ségui formation (Figure 9b).
F3 fault (Figure 9c) generated by the erosion of average direction 70° N, 60° S, the pitch of striae is oriented in 75° E.
The geometrical arrangement of these three faults shows inverse systems. They bring the conglomerate deposits of the Upper Pleistocene to Holocene into abnormal contact with the sands and clays of the Segui formation (Neogene) arranged vertically to sub-vertically.
Statistical analysis of lineaments
The authors who have explored the statistical analysis of lineaments [50-54] have aimed to study the geometry of the network of lineaments and to identify the dominant directions at regional and local levels.
The new map of fractures (Figure 10) obtained in this study after various processing steps and exploiting the complementarity of the different media, has approximately 1819 fractures of varying sizes and lengths. Lengths range between 0.80 km and 46.26 km. The most important lineament is discontinuous and oriented in the E-W (N90) direction. It crosses longitudinally the study area (East-West) through the southern sides of the Metlaoui mountain chain. Apart from this lineament exceptionally long, 89% of fractures are smaller than 3 km and short fractures are the most frequent (212 certainly lineament and 1607 probable lineament). Lineaments are grouped according to their orientation, shape, density and size. Figure 11 shows the frequency distribution of lineament directions by 10° amplitude class and in proportion of the total length. According to Figure 11, the main frequent directions are: NE-SW; NW-SE, NNE-SSW; E-W and N-S.

Figure 10: A new map of tectonic lineaments of Metlaoui region.

Figure 11: Rose wind chart of frequency distribution of lineament directions in proportion of the total length.
Validation
Phase control and validation of geological accidents extracted from maps, aerial photography, ASTER and ETM+is essential to assess the accuracy of the mapped lineaments. The linear structures identified from satellite images were the subject of a frequency analysis where the main directions were compared to those obtained based on the topographic map and from photointerpretation analysis. For the validation purpose, these linear structures were compared to lineaments extracted from geological maps and field observations.
When the anthropogenic pattern of certain linear structures is proven (roads, railways, agricultural parcel boundaries, etc.), they are removed after verification in the field. Thus, the detailed map of the lineaments (Figure 10) shows the certain and probable faults. It shows a high density of lineaments of varying sizes ranging from a few hundred meters to several kilometers. They come in different forms: rectilinear, in curved lines and as piano keys. Based on the density of these tectonic lineaments, their shape, their orientation and their length, the distinguished linear groups are those of mean directions N180 (North-South), N120 to N130 (North West-South East), N22 to N45 (North East-South West) and N 90 (East-West).
This last group corresponds to the longitudinal fault of the Metlaoui chain, mentioned practically in all the previous studies achieved on this region. This methodological approach allows to highlight that the chain of the Metlaoui region is strongly tectonized. Morpho-tectonic analysis reveals that the arrangement of geomorphological landscapes on the southern mountains and foothills is strongly controlled by neotectonics.
Discussion
The application of directional filtering techniques on ASTER and ETM+images has resulted in the enhancement of lineaments making them more detectable. This has made it possible to map multidirectional linear networks on a large scale.
Several studies [15,16,18-22] presented a synthetic and a critical analysis of the use of satellite imagery for the detection of linear elements. In our work, the detailed map of the lineaments mapped by satellite imagery involved numerous fractures in all directions of local and even regional extensions. Some mapped lineaments do not appear in previous studies. Indeed, previous studies on fracturing in this region were sparse [15,37]. The large, east-west oriented lineament, clearly visible on the satellite images, corresponds to the longitudinal fault south of the southern foothills of the Metlaoui chain. This fault has already been mapped but it was only partially delimited. In this study, we show that this fault extends in the Algerian territory and has a length of about 46.26 km on the studied area. Lineaments from satellite images have been identified and recognized in the field as existing faults. The major lineaments identified are related to the directional fault of Metlaoui and its auxiliaries.
In comparison with studies in other regions, the results of this study are consistent with those obtained by the Quebec Appalachians; Youan in northeastern Côte d'Ivoire [35]; Himyari in Morocco [18]; Ezzine in central and northern Tunisia and Marghany (2010) in Arabian Peninsula. These authors used combinations of images; texture analyzes and filters of different sizes to produce detailed maps of lineaments. All of these techniques allowed to update existing fracturing maps highlighting many other fractures that were not reported before. In this study, results are in agreement with neotectonic and seismotectonic data and with the previous studies, especially with Ben Ouezdou and Zargouni [35,41]. This study has revealed the important role played by the East-West fault- MtalgaMetlaoui. This vulnerability provides an irrefutable argument of neotectonic activity in the South-West of Tunisia. Dlala and Hfaeidh found a strong link between the fault of Metlaoui-Mtalga and NW-SE fault Gafsa-Sehib and seismicity recorded November 7, 1989 in Metlaoui region [40]. The F1 and F2 preexisting faults of Metlaoui-Thelja (Figure 9) identified in this study provide another example of the spectacular neotectonic activity in the region.
Conclusions
In the context of southern Tunisia, characterized by high aridity, soils are generally loose, without vegetation or very sparse, and they are strongly subject to the action of the rains. Satellite imagery has made it possible to highlight the great heterogeneity of these environments and the various linear structures of various origins that cross these areas. The filtering applied to the red band, more sensitive to the soil surface properties, made it possible to map with precision all the existing linear structures. The filtering process has resulted in radiometric enhancements of the images making them more practical for the mapping of linear structures. The statistical analysis of these lineaments showed a distribution of their orientation with dominance of the direction NE-SW to E-W.
The interpretation of the results and the validation work achieved in this study, based on previous studies, geological maps and more particularly on extensive field campaigns have allowed to retain only lineaments that have geological and structural meanings. Compared to what is known about this region, this study has provided evidence of the existence of previously unknown faults. The synthesis map updates and improves significantly the fragmented knowledge on this region. This synthesis map of lineaments can also be considered as a tool that allows for a better understanding of the influence of certain tectonic accidents during the recent quaternary period on the arrangement of the forms of the relief and the recent evolution of the landforms, and also the strong link with the seismicity recorded in the Metlaoui region.
Author Contributions
This work was accomplished thanks to the significant participation of the co-authors. S. Aliouet is the main author and his involvement concerned all the stages of the study (implementation of the methodology, processing and analysis of satellite images, aerial photographs, topographic and geologic maps, validation based in particular on intensive field campaigns, as well as the preparation of the original manuscript). K. Soudani, was at the origin of this comparative study which combines remote sensing, GIS and field validation approaches. His contribution particularly concerned the implementation of the methodology, results analysisand the revision of the manuscript. F. Melki, as a structural geologist, his contribution was particularly concerned the interpretation of the results and the revision of the manuscript. A. Boujarra, as a geomorphologist, has particularly participated significantly in field campaigns, observations, results interpretation and validation.
Funding
This work has received funding from the Ministry of Higher Education and Scientific Research of the Republic of Tunisia as part of an alternating scholarship, which allowed the first author to achieve a scientific internship at ESE laboratory, Paris-Sud University in France.
Acknowledgments
This work would not have been possible without the contributions of many people. We would like to thank Professor Hédi Ben Ouezdou, Mohamed Fouad Zargouni, MahmedOuaja and Nabil Gasmi for their constructive comments and discussions.
REFERENCES
- Hobbs WH. Lineaments of the atlantic border region. Geol Soc America Bull. 1904;15:483-506.
- Hobbs WH. Earth features and their meaning: New York. Macmillan Co. 1912;53:506.
- Wilson JT. Structural features in the northwest territories. Am Jour Sci. 1941;239:493-502.
- Kaiser EP. Structural significance of lineaments. Geol Soc America Bull. 1950;61:1475-1476.
- Gross WH. A statistical study of topographic linears and bedrock structures. Geol Assoc Canada Proc. 1951;4:77-87.
- Kelly VC. Regional tectonics of the colorado plateau and relationship to the origin and distribution of uranium. New Mexico Pubs Geol. 1955;5:120.
- Kupsch WO, Wild J. Lineaments in avonlea area, Saskatchewan. Am Assoc Petroleum Geo Bull. 1958;42:127-134.
- Lattman LH. Technique of mapping geologic fracture traces and lineaments on aerial photographs. Photogramm Eng. 1958;24:568-576.
- Hills ES. Elements of structural geology: New York, USA, 1963;483.
- Brock BB. A global approach to geology: Cape Town, South Africa, 1972;365.
- Gay SP. Aeromagnetic lineaments: Salt Lake City, Utah. Amer Stereo Map Co. 1972;5:94.
- Offield TW. Line-grating diffraction in image analysis: Enhanced detection of linear structures in ERTS images, Colorado Front Range. Remote Sens. 1975;5:101-107.
- O’Leary DW, Friedman JD, Pohn HA. Lineament, linear, lineation: Some proposed new standards for old terms. Geo Soc America Bull. 1976;87:1463-1469.
- Slemmons DB. A Procedure of analyzing fault controlled lineaments and the active-controlled lineaments and the activity of faults. Rem Sens. 1977;5:33-40.
- Zargouni F. Style et chronologie des déformations des structures de l’atlas tunisien, méridionale. Evol. 1984;11:71-76.
- Scanvic JY. Utilisation de la télédétection dans les sciences de la terre. Manuels et Méthodes, Éditions du BRGM, Orléans, France, 1983;4:159.
- Raghavan V, Masumoto S, Koike K, Nagano S. Automatic lineament extraction from digital images using a segment tracing and rotation transformation approach. Comp Geosci. 1995;21(4):555-594.
- Lachaine G. Structures géologiques et linéaments, Beauce (Québec):apport de la télédétection. Mém Sci. 1999;61:105.
- Himyari SM, Hoepffner C, Benzakour M, Hadani DE. Etude structural du haut atlas oriental Maroc à l’aide de l’analyse linéamentaire des images HRV XS de Spot. Télédétection. 2002;2:243-253.
- Songmuanga R, Charusiria P, Choowonga M, Won-Ina K, Takashima I, Kosuwan S. Detecting Active faults using remote-sensing technique: a case study in the sri sawat area, western thailand. Science Asia. 2007;33:23-33.
- Youan T, Lasm T, Jourdal P, Kouamé KF, Razack M. Cartographie des accidents géologiques par imagerie satellitaire LANDSAT-7 ETM+et analyse des réseaux de fractures du socle précambrien de la région de BANDOUKOU (Nord Est de la Côte d’Ivoire). Revue Télédétect. 2008;8(2):119-135.
- Marghany M, Hashim M. Developing adaptive algorithm for automatic detection of geological linear features using RADARSAT-1 SAR data. Intern J Phy Sci. 2010;5(14):2223-2229.
- Said A. Tectonique active de l'Atlas Sud Tunisien: approche structurale et morphotectonique. Rem Sens. 2011;11:228.
- Lopes A, Touzi R, Nezry E. Adaptive speckle filters and scene Heterogeneity. Geosci Remote Sens. 1990;28(6):765-778.
- Lopes A, Nezry E, Touzi R, Laur H. Structure detection and statistical Adaptive Speckle filtering in SAR image. Int J Remote Sens. 1993;14(9):1735-1758.
- Nezry E, Beaudoin A, Lopes A, Rudant JP. Preprocessing of multifrequency SAR images: application to geological study of karstic formations (Le Larzac-France). Intern Geosci Rem Sens. 1993;2135-2137.
- Dong Y, Milne AK, Forster BC. Toward edge sharpening: A SAR speckle filtering algorithm. Geosci Remote Sens. 2001;39(4):851-863.
- Maged M. Radar automatic detection algorithms for coastal oil spills Pollution. Intern J Appl Earth Observ Geo Informat. 2001;3(2):191-196.
- Maged M. Operational texture algorithms for oil spill detection from RADARSAT data. J Photogram Geo informat. 2001;5:353-359.
- Helmy AK, El-Taweel GS. Speckle suppression of radar images using normalized convolution. J Comp Sci. 2010;6(10):1125-1129.
- Lee JS, Schuler D, Ainsworth TL, Krogager E, Kasilingam DMA, Boerner WM. On the estimation of radar polarization orientation shifts induced by terrain slopes. Geosci Rem Sens. 2002;40:30-41.
- Hondt OD, Ferro-Famil L, Pottier E. Nonstationary spatial texture estimation applied to adaptive speckle reduction of SAR data. Geosci Remote Sens Lett. 2006;3(4):476-480.
- Roux H. Les plis des environs de Redeyef (sud tunisiens). Bull Soc Géol. 1911;16:249-284.
- Vaufrey R. Les plissements acheuléo-moustériens des alluvions de Gafsa. Rev Géog phys Géol dyn. 1932;6:299-321.
- Castany G. Orogenèse quaternaire dans la région de Gafsa. Bull Soc Nat Tunisie. 1953;6:151-160.
- Castany G, Gobert EG. Morphologie quaternaire, paléontologie et leurs relations à Gafsa, Libica, Algeria, 1954;9-37.
- Zargouni F. Tectonique de l’Atlas méridional de Tunisie:évolution géométrique et cinématique des structures en zone de cisaillement. Sci Terre INSRT Tunis. 1986;12:304.
- Boukadi N. Evolution géométrique et cinématique de la zone d'interface de l'axe Nord-Sud et de la chaîne de Gafsa (Maknassy-Mezzouna et jbelBouhedma) Tunisie. Sci Terre INSRT Tunis. 1985;8:154.
- Boukadi N. Sur le plissement disharmonique et la dispersion des axes de plis dans les couloirs de déchrochement: l'exemple du faisceau de plis de moularès de Tunise. Acad Sci. 1989;208:2105-2110.
- Zouari H, Turki MM, Delteil J. Nouvelles données sur l'évolution tectonique de la chaîne de Gafsa. Bull Soc Géol Fr. 1990;6:621-628.
- Sghari A. Sédimentation et morphogenèse au Néogène-Quaternaire en Tunisie méridionale, Pasteur Strasbourg, France, 1991.
- Dlala M, Hfaidh M. Le séisme de 7 novembre 1989 à Metlaoui (Tunisie, méridionale):Une tectonique active en compression. Accad Sci. 1993;317:1297-1302.
- Ben-Ouezdou H, Zargouni F. Nouvelles données à propos du quaternaire et de la tectonique récente dans la chaîne Metlaoui (Sud-Ouest de la Tunisie) Méditerranée. Rem Sens. 1988;22:232-233.
- Ben-Ouezdou H. La partie méridionale de steppes tunisiennes, étude géomorphologique. Doct Tunis. 1994;2:577.
- Riley PC, Gordon JA, Simo B. Structure of the alima and associated anticlines in the foreland basin of the southern Atlas Mountains, Tunisia. Lithosph. 2011;3(1):76-91.
- Gasmi A. la partie occidentale des basses plaines méridionales (sud ouest de la Tunisie):Géomorphologie et évolution du milieu naturel. Doct Lett Tunis. 2012;260.
- Aliouet S. Le chaînon montagneux de Metlaoui et ses piémonts méridionaux. Doc Sci Tunis. 2017;6:275.
- Caire A. Fracturation profonde et tectonique linéamentaire theme Reunioann. Soc Géol Fr. 1975;55.
- Haralick M, Sternberg A, Zhuang X. Image analysis using mathematical morphology, ieee transactions on pattern analysis and machine intelligence. 1987;8:532-550.
- Deslandes S, Gwyn Q. Évaluation de SPOT et SEASAT pour la cartographie des linéaments: comparaison basée sur l'analyse de spectres de Fourier. J Can Télédétect. 1991;2:98-110.
- Kamoun Y. Néotectonique en Tunisie: Essai de synthèse à partir d’exemples choisis le long des côtes. Cong Nat Sci Terre. 1981;11:417-421.
- Pretorius JP, Partridge TC. Analysis of angular atypicality of lineaments as aid to mineral exploration. J Afr Min Metall. 1974;74(10):367-369.
- Scanvic JY. Télédétection aérospatiale et informations géologiques. Man Méthod. 1986;15:284.
- Aissaoui S. Les structure liées à l’accident sud atlasique entre Biskra et la jbelManndra, Algérie; évolution géométrique et cinématique. Pasteur Strasbourg, France, 1984.
Citation: Aliouet S, Soudani K, Melki F, Ahmed B (2020) Complementarity of Optical Remote Sensing and Geographic Information System for Detection and Mapping of Geological Lineaments: A Case Study in the Metlaoui Region in Southern Tunisia. J Remote Sens GIS. 9:277. DOI: 10.35248/2469-4134.20.9.277
Copyright: © 2020 Aliouet S, et al. This is an open-access article distributed under the terms of the Creative Commons Attribution License, which permits unrestricted use, distribution, and reproduction in any medium, provided the original author and source are credited.