Indexed In
- Open J Gate
- RefSeek
- Hamdard University
- EBSCO A-Z
- OCLC- WorldCat
- Publons
- International Scientific Indexing
- Euro Pub
- Google Scholar
Useful Links
Share This Page
Journal Flyer

Open Access Journals
- Agri and Aquaculture
- Biochemistry
- Bioinformatics & Systems Biology
- Business & Management
- Chemistry
- Clinical Sciences
- Engineering
- Food & Nutrition
- General Science
- Genetics & Molecular Biology
- Immunology & Microbiology
- Medical Sciences
- Neuroscience & Psychology
- Nursing & Health Care
- Pharmaceutical Sciences
Research Article - (2020) Volume 9, Issue 1
Assessment of Land Use and Land Cover Change Using GIS and Remote Sensing: A Case Study of Kieni, Central Kenya
Maina J1*, Wandiga S1, Gyampoh B1 and Charles KKG22Department of Land Resource Management and Agricultural Technology, University of Nairobi, Nairobi, Kenya
Received: 26-Dec-2019 Published: 21-Jan-2020, DOI: 10.35248/2469-4134.20.9.270
Abstract
To investigate land use land cover changes (LULCC) in the Kieni sub-county in Central Kenya from 1987 to 2017, remote sensing and Geographical Information System (GIS) was used. This was done by downloading and processing landsat images of 1987, 1995, 2000, 2010 and 2017. Methods employed were, data identification and acquisition, image processing, validation and presentation. There were six classifications analysed which were; bare areas, bushlands, farmlands, forest, grasslands and waterbodies. The results showed an increase in the classes of water bodies, farmlands and bare areas by 314.86%, 160.45% and 73.18% respectively over the 30-year period. The results also showed a decrease in the land use land cover classes categories of forest, bushlands and grassland by 45.94%, 38.73% and 29.66% respectively. Therefore, in conclusion, there were land use and land cover changes in the study area over the 30-year period between 1987 and 2017 as illustrated by results that showed that farmlands classification increased by more than one and half times while forest cover was reduced by about a half.
Keywords
Land use; Land cover; Remote sensing; GIS; Landsat images; Data; Classification
Introduction
Land cover refers to the physical and biological cover over the land surface, including; vegetation, bare soil, water and artificial structures. Land use is defined as any physical and biological or chemical change to the physical and biological attributes of land which may be attributed to management [1]. Land use and land cover change is a major concern with regards to change in the global environment [2]. Land cover is fundamental variable that impacts on and links many parts of the human and physical environment. It is well established that land cover change has significant effects on basic processes including biogeochemical cycling and thereby on global warming, the erosion of soils and thereby on sustainable land use and for the next 100 years is likely to be the most significant variable impacting on biodiversity [3]. Land-use and land-cover changes (LUCC) increasingly have been regarded as a primary source of global environmental change such as emission of greenhouse gases, global climate change, loss of biodiversity, and loss of soil resources [4-6]. Frequently updated land use land cover information is essential to many socio-economic and environmental applications, including urban and regional planning, natural resources conservation and management among others.
Urbanization, population growth, land scarcity and expansion of agricultural land are among the many drivers of LULCC in the world [1,7]. The indicators of LULCC manifest as the current global environmental concerns such as increasing concentrations of greenhouses gases in the atmosphere, loss of biodiversity and conversion and fragmentation of natural vegetation areas [7-9].
According to Masek et al. [8], land use and land cover changes respond to forces which are largely associated with the high human population such as socioeconomic, political, cultural, demographic and environmental. With the current increase in population, the current rates, extents and intensities of LULCC may also increase. As a result, land resources in Kenya are strained given that approximately 75% of the population engages in agriculture but only 20% of its land is arable. This has accelerated the unprecedented changes in ecosystem and environmental processes in the country [10,11]. Therefore, the use of remote sensing data and analysis techniques provide accurate, timely and detailed information for detecting and monitoring changes in land cover and land use.
Remote sensing (RS) is a powerful tools in deriving accurate and timely information on the spatial distribution of land use/land cover changes over large areas [12-14]. GIS provides a platform for collecting, storing, analyzing and displaying digital data necessary for change detection [15]. Remote sensing imagery is the most important data resources of GIS. Satellite images are used for recognition of synoptic data of earth’s surface over time [16]. Landsat Multispectral Scanner (MSS), Thematic Mapper (TM) and Enhanced Thematic Mapper Plus (ETM+) data have been broadly employed in studies towards the determination of land cover since 1972, the starting year of Landsat program, mainly in forest and agricultural areas [17]. The rich archive and spectral resolution of satellite images are the most important reasons for their use.
The aim of digital change detection process is to recognize LULC on features of interest between two or more dates [18]. Several techniques have been developed to detect changes in LULC including; use post classification comparison, conventional image differentiation, using image ratio, image regression, and manual on-screen digitization of change principal components analysis and multi date image classification [19]. Studies have demonstrated that postclassification comparison is the most accurate procedure and presented the advantage of indicating the nature of the changes [20,21].
The various methods of detecting in change Land cover, the studies assessed their performance and they show that uniform types of data combined with methods used have unequal success [18]. This notwithstanding, comparative analysis of independently produced classifications and simultaneous analysis of multi-temporal data are the frequently applied approaches in change detection analysis. Examples of simultaneous analysis techniques as reported by Coppin et al. [18] are image differencing, rationing, principal component analysis (PCA) together with change vector analysis. The mathematical difference between two dates of geo-registered images is involved in the image differencing. Although the method produces good results, it is recommended that image differencing should be used in combination with other methods to procedure adequately reliable surface changes [2]. Comparative analysis involves the conversion of independently classified images to same projections. This method allows for compensation for climatic and atmospheric condition changes. However, it has been criticized as it increases errors that may have occurred in the first two classifications [3,22].
As stated by Lambin and Strahler [23], detection by remote sensing the change processes of land cover are enhanced when slope and topography which are some of the land surface spectral and spatial indicators are incorporated. It is further recommended that that the indicators be more sensitive to fluctuations in the primary productivity which is associated with the climatic conditions inter-annual variability [23]. Temporal aspects of land surface like vegetation growth and soil moisture are important for image interpretation because they vary during the growing season. Encouraging results can therefore be gained from analyzing images from various instances during the annual growing cycle [22].
Following image classification, accuracy assessment is conducted to determine the level of classification acceptance and the process of change detection. EPA [24] ascribed the use of error matrix and one-point-in-time as the standard accuracy assessment procedures. However, the methods best suited for both small areas as well as single time durations which may be difficult to apply on a multi-temporal change analysis because of the difficulties to acquire adequate database of historical reference materials [18]. Hence, accuracy assessment is normally limited to the recent image that serving as a reference by using ground control points (ground truthing) which is collected as part of the data needed for change analysis.
Multi-temporal analysis of satellite imagery is effective for change detection only because of the high correlation between imagery spectral variation and land-cover change [25]. Therefore, the main aim of this study was to carry out land use and land cover analysis of Tigithi, Central Kenya and specifically image interpretation and classification, LULC change analysis and accuracy assessment. This was to aid in the assessment of the changes in the land cover in the years between 1987 and 2017 a period of 30 years.
Materials and Methods
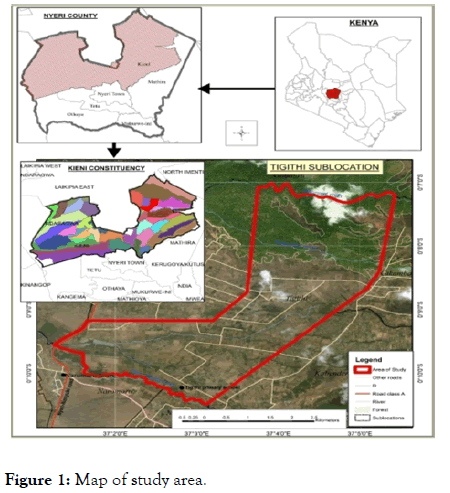
The research took place in Kieni sub-county which is located in central Kenya (Figure 1). Datasets used for this research were divided into two: Satellite and ancillary data.

Figure 1. Map of study area.
The later included field data which was used as ground truth data for the land use/land cover classes, topographic map sheet No. 121_1 scale 1: 50,000, Roads, Digital elevation model of 30 m resolution was used to generate the drainage network, and Administrative boundaries including sub-locations, locations, constituencies, counties.
The ground truth data was collected during September 2017 which was a dry season and it was used for image classification and overall accuracy assessment. Landsat images (with path/ row168/060) for 5 epochs, 1987, 1995, 2002, 2010 and 2017 consisted of multispectral data acquired by Landsat satellite for the months of January and February. The specifications of the satellite data acquired for change analysis (Table 1) [26]
| Data | Year | Band | Resolution (m) |
|---|---|---|---|
| Landsat 5 | 1987 | TM | 30 |
| Landsat 5 | 1995 | TM | 30 |
| Landsat 7 | 2002 | Enhanced TM | 30 |
| Landsat 5 | 2010 | TM | 30 |
| Landsat 8 | 2017 | OLI and TIRS | 30 |
Table 1: Collected Satellite Images where TM is Thematic Mapper, OLI and TIRS stands for Operational Land Imager and Thermal Infrared Sensor respectively [26].
Datasets were obtained and collected from the following sources shown in Table 2 below.
| Dataset | Source | Description |
|---|---|---|
| Topo Map | Survey of Kenya [26] | 1: 50,000 |
| Roads Data | Kenya Roads Board [27] | Classified roads |
| Administrative Boundaries | IEBC | Sub-location, locations and county boundaries |
| Satellite Images | USGS Earth explorer | Landsat5, 1987,1995 and 2002, landsat7-2010 and Landsat 8-2017 |
| Resolution 30 m |
Table 2: Data Sources where IEBC is Independent Electoral and Boundaries Commission (Kenya).
Satellite image acquisition, ancillary data acquisition, preprocessing, image classification, ground truthing, accuracy assessment and output derivation ere the main components involved in this study. From the Kenya digital elevation model (DEM), a smaller area covering Nyeri county was clipped out to generate the drainage network. Topographical map was obtained to act as a guide for interpretation. Therefore, to overlay with the other datasets it was necessary to Georeference it, that is, assigning real world coordinates to the image coordinates. The four extreme corner points were used and their coordinates were in Universal Transverse Mercator coordinate system.
Original Landsat images were obtained in Geotiff format that required to be converted into Idrisi software so that they could be displayed and explored in the software for processing. Since Landsat scene covers an area of 185 square kilometers which necessitated the area of study to be extracted from the bigger imagery to speed up image processing. Tigithi boundary was used to define this area of interest and thereafter image enhancement was done.
The image visual interpretability was improved by the image enhancement by increasing the various feature distinctions [29]. The process of visually interpreting enhanced imagery attempted to optimize the complementary abilities of the human mind and the computer. The human mind is good at interpreting spatial attributes on an image and can identifying obscure or subtle features [30]. Image enhancement therefore, was concerned with the modification of images to make them more suited to the capabilities of human vision. Contrast enhancement and band combination were two techniques used in this study. Different band combination of the Landsat images was tested and displayed to create different composite effects and increased interpretation on LULC. The most common ones applied in this case were; true color composite, false color composite and natural color composite.
Mapping out remotely sensed data digitally, through the process of image classification, land cover classes are realized. The main objective of the image classification process was to automatically categorize the pixels in an image into either various land cover classes or themes [30]. This was done based on the Digital Number (DN) values of the pixel which in turn represented the spectral properties of the ground surface. More technically, it was an aspect in which quantitative decisions were made on the basis of the data present in the image, grouping pixels or regions of the image into classes representing different ground-cover types.
Unsupervised image classification seeks to group together cases by their relative spectral similarity while the supervised aims to allocate cases on the basis of their similarity to a set of predefined classes that have been characterized spectrally [3].
The study utilized both supervised for 2017 and unsupervised classification for 1987, 1995, 2002 and 2010.The algorithm employed for supervised classification was Maximum Likelihood Classifier while the supervised classification was ISODATA technique (Iterative Self-organizing Data Analysis). The algorithm analyzed all the bands of the image and picked out the clusters of pixels having similar values without the user intervention. The clusters were then assigned to their classes at the user’s discretion. These methods were then complemented with ground truthing, Google earth and topographical map to assign clusters to their classes.
Ground verification was conducted using simple Random sampling ensuring that all classes were collected and the samples well distributed within the area of study. Even basic sampling designs like simple random sampling, can be appropriate if the sample size is large enough to make sure of adequate representation of all classes [3]. The verification was done using error/confusion matrix which contains information about actual and predicted classes done by a classification process [31]. This means that the pixels that had been categorized from the satellite image was compared to the same site in the field.
Results
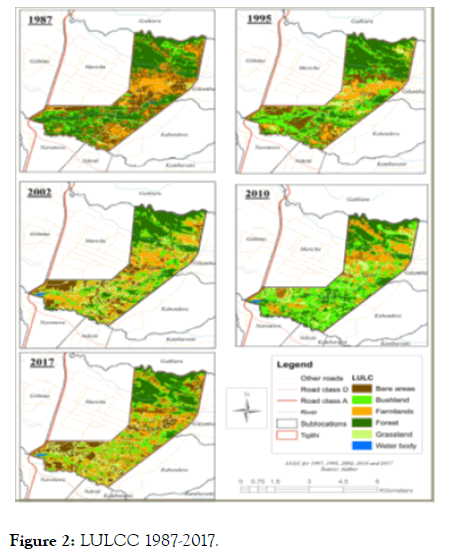
All the Landsat images for 1987 to 2017 a 30-year period were processed and the particular years analysed for land use and land cover changes were 1987, 1995, 2002, 2010 and 2017.The study area land cover was classified into six classifications namely; Bare-lands, bushlands, farmlands, forest, grassland and water bodies as illustrated in Figure 2 below. The figure showed the progression of the land cover of the six classifications from 1987 to 2017.

Figure 2. LULCC 1987-2017.
Figure 2 was a visual illustration of the areas being covered by the six land cover classifications as they changed from 1987 to 2017. The maps also showed the administrative divisions and major roads in the area as well as the in the areas neighbouring. By properly coding the classification results for the various epochs, change maps were produced to show a complete matrix of change as shown in Table 3.
| LUCLC (%cover) | 1987 | 1995 | 2002 | 2010 | 2017 |
|---|---|---|---|---|---|
| Bare areas | 13.2 | 20.75 | 24.28 | 10.92 | 22.56 |
| Bushland | 24.5 | 17.64 | 12.84 | 19.06 | 15.01 |
| Farmlands | 12.54 | 18 | 28.65 | 30.98 | 32.66 |
| Forest | 35.46 | 31.1 | 23.03 | 25.68 | 19.17 |
| Grassland | 14.23 | 12.49 | 10.91 | 13.02 | 10.01 |
| Waterbody | 0.07 | 0.02 | 0.29 | 0.34 | 0.29 |
| Total | 100 | 100 | 100 | 100 | 100 |
Table 3: Land Use Land Cover change percentage.
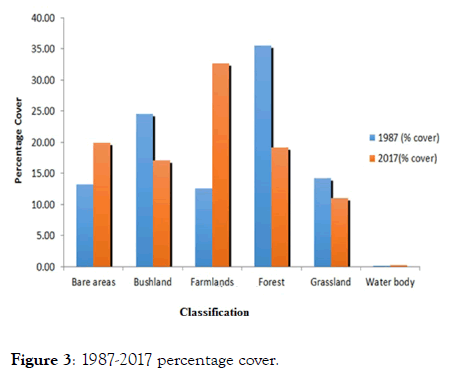
The land cover for bare lands increased from 13.2% in 1987 to 22.56% in 2017 while that for bushland decreased from 24.5% in 1987 to 15.01% in 2017. Land cover in the farmlands classification rose from 12.54% in 1987 to 32.66% in 2017 which was an inverse reaction to forest cover which decreased from 35.6% in 1987 to 19.17% in 2017. However, the grasslands land cover area registered only a slight decrease from 14.23% in 1987 to about 10% in 2017 while the water bodies change was from 0.07% in 1987 to 0.29% thirty years later.
To compare the land percentage, within the period of 30 years from 1987 to 2017 Figure 3 above was generated and it showed that from 1987 to 2017 there were increments in percentage cover of the bare lands and farmlands classifications while bushlands, forest and grasslands went down. The classification that showed a big percentage cover change was the farmlands which increased by slightly over 160% followed bay bare areas with about 73%. Forest cover decreased by about 46% from 1987 to 2017 while bushlands also went down by about 39% within the same time. Grasslands percentage cover decreased by about 30% while the water bodies percentage cover increased by over 300%.

Figure 3. 1987-2017 percentage cover.
Discussion
Change in the global environment is affected by various changes in land use and land cover [2]. Urbanization, population growth, land scarcity and expansion of agricultural land are among the many drivers of LULCC in the world [32]. Therefore, the use of remotely sensed data and applying the analysis techniques provide accurate, timely and detailed information for detecting and monitoring changes in land cover and land use.
In this study, there were six classifications bare areas, bushlands, farmlands, forest, grassland and the water bodies. The bare areas had a difference in percentage cover of about 10% from 1987 to 2017 while the bushlands had a negative difference in percentage cover 9.5% over the same period. The forest had a negative percentage cover difference of -30% an indication of decrease while on the other hand the farmlands increased by about 20% and grasslands had a percentage cover reduction by about 4%. Water bodies percentage cover increased by 0.22% in 2017. Masek et al. [8] reported that, land use and land cover changes respond to forces which are largely associated with the high human population such as socioeconomic, political, cultural, demographic and environmental. With the current increase in population, the current rates, extents and intensities of LULCC may also increase and as a result, land resources in Kenya will be strained given that approximately 75% of the population engages in agriculture but only 20% of its land is arable.
Conclusion
The 1987-2017, a 30-year period saw a change in the land use in the area with the following classifications increasing: farmlands from 12.54% to 32.66%, water bodies 0.07% to 0.29% and barelands from 13.2% to 22.56%. The classifications that realised a reduction were: bushlands 24.5% to 15.01%, forests 35.6% to 19.17% and grasslands 14.23% to 10%. Therefore, land use and land cover was detected in the area over the 30-year period under review.
REFERENCES
- Quentin FB, Jim C, Julia C, Carole H, Andrew S. Drivers of land use change, Final report: Matching opportunities to motivations, ESAI project 05116, Department of Sustainability and Environment and primary industries, Royal Melbourne Institute of Technology.2006.
- Qian J, Zhou Q, Hou Q. Comparison of pixel-based and object-oriented classification methods for extracting built-up areas in arid zone. InISPRS workshop on updating Geo-spatial databases with imagery & the 5th ISPRS workshop on DMGISs. 2007;36:163-171.
- Foody GM. Status of land cover classification accuracy assessment.Remote Sensing of Environment. 2002; 80:185-201.
- Ecosystems and human well-being, Washington, DC. In: Assessment ME (eds) . Island press, 2005.
- Lambin EF, Rounsevell MDA, Geist HJ. Are agricultural land-use models able to predict changes in land-use intensity? Agriculture, Ecosystems & Environment. 2000; 82:321-331.
- Boissiere M, Sheil D, Basuki I, Wan M, Le H. Can engaging local people’s interests reduce forest degradation in Central Vietnam? Biodiversity and conservation. 2009;18(4/354):2743-2757.
- Global Change and the Earth System: A planet under pressure. In: Steffen W, Tyson P (eds) Environmental Policy Collection, UNT Digital Library, USA 2001.
- Masek JG, Lindsay FE, Goward SN. Dynamics of urban growth in the Washington DC metropolitan area, 1973-1996, from Landsat observations. International Journal of Remote Sensing. 2000;21:3473-3486.
- Anthropogenic biomes. In: Ellis E, Ramankutty K. (eds) Encyclopedia of Earth 2007.
- Root causes of land use change in the Loitokitok Area, Kajiado District, Kenya. In: Campbell DJ, Lusch DP, Smucker TA, Wangui EE (eds) Working Paper Series, No 19. Michigan State University 2003;pp:1-32.
- Land use in Kenya: the case for a national land-use policy. In: Mwagore D(eds) Kenya Land Alliance,Vol 3. 2003.
- Carlson TN, Sanchez-Azofeifa GA. Satellite remote sensing of land use changes in and around San Jose, Costa Rica. Remote Sensing of Environment. 1999;70(3):247-256.
- Guerschman JP, Paruelo JM, Bella CD, Giallorenzi MC, Pacin F. Land cover classification in the Argentine Pampas using multi-temporal Landsat TM data. International Journal of Remote Sensing. 2003;24(17):3381-3402.
- Rogan J, Chen D. Remote sensing technology for mapping and monitoring land-cover and land-use change. Progress in Planning. 2004;61(4):301-25.
- Fundamentals of geographic information systems. In: DeMers MN (eds) John Wiley & Sons 2008.
- Ulbricht KA, Heckendorff WD. Satellite images for recognition of landscape and landuse changes. ISPRS Journal of Photogrammetry and Remote Sensing. 1998;53(4):235-243.
- Introduction to remote sensing. In: Campbell JB, Wynne RH (eds) Guilford Press 2011.
- Coppin P, Jonckheere I, Nackaerts K, Muys B, Lambin E. Review ArticleDigital change detection methods in ecosystem monitoring: a review. International Journal of Remote Sensing. 2004;25(9):1565-1596.
- Lu D, Mausel P, Batistella M, Moran E. Land‐cover binary change detection methods for use in the moist tropical region of the Amazon: a comparative study. International Journal of Remote Sensing. 2005;26(1):101-114.
- Dessie G, Kleman J. Pattern and magnitude of deforestation in the South Central Rift Valley Region of Ethiopia. Mountain Research And Development. 2007;27(2):162-169.
- Mas JF. Monitoring land-cover changes: a comparison of change detection techniques. International Journal of Remote Sensing. 1999;20(1):139-52.
- Remote Sensing and Image Interpretation. In: Lillesand TM, Kiefer RW (eds) Johan Willey and Sons Inc 1994.
- Lambin EF, Strahlers AH. Change-vector analysis in multitemporal space: a tool to detect and categorize land-cover change processes using high temporal-resolution satellite data. Remote Sensing of Environment. 1994;48(2):231-244.
- Integrated risk information system (IRIS). In; EPA U (eds) EPA, Washington, DC 1999.
- Green K, Kempka D, Lackey L. Using remote sensing to detect and monitor land-cover and land-use change. Photogrammetric engineering and remote sensing. 1994:60(3):331-7.
- The United States Geological Survey (USGS, formerly simply Geological Survey). In: Explorer UE. United States government. Virginia, United States 1879.
- Ministry of Land and Physical Planning, Kenya.
- Kenya Roads Board, Kenya.
- Shalaby A, Tateishi R. Remote sensing and GIS for mapping and monitoring land cover and land-use changes in the Northwestern coastal zone of Egypt. Applied Geography. 2007;27(1):28-41.
- Remote sensing and image interpretation. In: Lillesand T, Kiefer RW, Chipman J (eds) John Wiley & Sons; 2015.
- Hasmadi M, Pakhriazad HZ, Shahrin MF. Evaluating supervised and unsupervised techniques for land cover mapping using remote sensing data. Geografia: Malaysian Journal of Society and Space. 2009;5(1):1-10.
- Global change and the earth system: A planet under pressure. In: Steffen W, Sanderson RA, Tyson PD, Jager J, Matson PA, Moore III B, et al. (eds) Springer Science & Business Media 2006.
Citation: Maina J, Wandiga S, Gyampoh B, Charles KKG (2020) Assessment of Land Use and Land Cover Change Using GIS and Remote Sensing: A Case Study of Kieni, Central Kenya. J Remote Sens GIS. 9:270. DOI: 10.35248/2469-4134.20.9.270
Copyright: © 2020 Maina J, et al. This is an open-access article distributed under the terms of the Creative Commons Attribution License, which permits unrestricted use, distribution, and reproduction in any medium, provided the original author and source are credited.

