Indexed In
- Open J Gate
- RefSeek
- Hamdard University
- EBSCO A-Z
- OCLC- WorldCat
- Publons
- International Scientific Indexing
- Euro Pub
- Google Scholar
Useful Links
Share This Page
Journal Flyer

Open Access Journals
- Agri and Aquaculture
- Biochemistry
- Bioinformatics & Systems Biology
- Business & Management
- Chemistry
- Clinical Sciences
- Engineering
- Food & Nutrition
- General Science
- Genetics & Molecular Biology
- Immunology & Microbiology
- Medical Sciences
- Neuroscience & Psychology
- Nursing & Health Care
- Pharmaceutical Sciences
Case Study - (2023) Volume 12, Issue 4
Applications of Geo-informatics in Watershed Management: A Case Study from Sai Watershed in Kumaun Himalaya, Uttarakhand
Prema Kaira1*, Naresh C Pant2 and Jyoti Joshi22Department of Geography, Soban Singh Jeena University, Almora, Uttarakhand, India
Received: 12-Jun-2023, Manuscript No. JGRS-23-21803; Editor assigned: 15-Jun-2023, Pre QC No. JGRS-23-21803 (PQ); Reviewed: 28-Jun-2023, QC No. JGRS-23-21803; Revised: 05-Jul-2023, Manuscript No. JGRS-23-21803 (R); Published: 12-Jul-2023, DOI: 10.35248/2469-4134.23.12.302
Abstract
Water is a primary element for the survival of every living being on the earth. Water management is a point of concern, especially in developing countries due to the lack of proper management and conservation of water. Geographical Information System (GIS) is useful to analyze and evaluate the geomorphological features of any watershed. GIS has developed as a tool for data sharing and collaboration presently being used in its identification, mapping, monitoring, management, analyses, evaluation, strategies and planning in different areas such as alternate land use practices, selection of sites for water harvesting structures for a watershed by integrating thematic information (land use, slope, drainage and soil) with socio-economic and other collateral information (like population, depth of weathering, well and crop inventory). This paper discusses various aspects of GIS for watershed development mapping such as base map, geological map for the purpose of rock and soil type, rainfall data, elevation, interrelationships of physiography of the drainage basin with land use and population structure. Chemical concentrations, monitoring of main and sub-streams and some traditional water resources (such as Dhare, Naule, Kund, Taals and Chal-Khal), create the strategies for drinking water, hydro-power production, agriculture irrigation, fisheries and animal husbandry and water conservation in the Sai watershed area. The most important role of GIS in watershed management is identifying the spatial patterns and various changes within the watershed area. It is also used for crop classification, rainfall, surface water inventory, mapping, and conservation, searching and monitoring of water percolation tanks, dug out ponds, check dams, rain water harvesting and strategies for watershed management.Keywords
Watershed management; Geographical Information System (GIS); Water conservation; Surface water
Introduction
Watershed is a geomorphic unit. It may be defined as the area which contributes water to a particular stream or set of streams [1]. It is also known as a drainage area, catchment area and watershed of a particular stream. It provides best way to measure water resource balance and response for various planning and management in sustainable development activities. It is accepted for different approaches in planning, development and management of surface land. Basically watershed is an area where all physical and human phenomenons found such as land, river, forest, settlement, bridge etc.
Watershed is widely recognized as a fundamental unit in the geomorphological milieu and also is being used as a basic unit for ecological research and environmental management because:
1. It is a limited convenient and usually clearly defined and unambiguous topographic unit, available in a nested hierarchy of sizes on the basis of stream ordering [2-6]. Different geomorphic landforms are output of river which is influenced by river size, stream ordering, velocity and sediment load.
2. It provides the best way to measure precipitation and solar radiation inputs and outputs of drainage [7]. As a result, there has been an increase in underground water level, wetland and humid soil.
3. Basin provides opportunity to estimate the amount of erosion because measurement of river flow and by knowing the area of the drainage basin and by assuming a diversity of material, rate of land erosion over the whole catchment may be deduced. It plays an important to mitigate land erosion, soil erosion and flood hazard.
4. It is easy to estimate the volume of material which has accumulated in the reservoir and if the date of construction of the reservoir is known, this can also provide the basis for and an estimate of land erosion rate.
5. The study of deposits within the basin or at the basin mouth can provide considerable information about the environmental processes and about chronology of events which occurred in the past. It influences ecology, environment and human habitats.
6. Drainage basins are mini-biospheres of earth and the first extension of mind to the environment.
7. Drainage basins focus on the monitoring of water and land the process whereby landscape is moulded, soils are moved around and nutrients cycled to plants and us [8]. Thus, it is obvious that a watershed has form, processes, system of processes and life.
The Sai is micro type watershed which is included in>400 hector area (41.39 km2). It lies in Someshwar valley in Kumaun division of Almora district in Uttarkhand. GIS is useful as a tool in a geographical unit i.e. a watershed for environmental management and Economic development. GIS tool is more important for physical aspect and human development because it is capable to capture, store, manipulate, analyze and visualize diverse set of spatial data. Today, GIS has become very useful and technological tool which is contributed in watershed management, planning and decision making. It is a very important in mountainous states because it is helpful to identify, visualize and give an attribute data of remote areas which are very sensitive for disasters and hazards.
The present study mainly focuses on the application of GIS in watershed management. The main thrust of this study discusses management and conservation of water. The following objectives are presented in this paper:
1. To study terrain analysis such as Digital Elevation Model (D.E.M.), Slope, Aspect and Drainage.
2. To study analysis Land use/Land cover pattern.
Methodology
The present study is based on secondary data. Secondary data are collected from DEM data like base, relief, slope, aspect and land- use which are the main inputs for the preparation of thematic layers. The study used data set collected from Literature review and Census of India, 2011. The maps of watershed are prepared by Geographical Information System (GIS) tools. Field observations were incorporated into the related thematic layer and well status map was prepared by plotting the well inventory data on the village maps. Land use/land cover map, drainage map and slope map are integrated with village map and analyzed to get village wise statistical findings.
Study area
The Sai watershed is an area of Someshwar valley of Almora district which lies in Kumaun Himalaya, Uttarakhand. It extends between 29 °46’48” N to 29049’44” N latitudes and 79° 32’44” E to 79 °36’22” E longitudes with an area encompassing 41.39 km2 (Figure 1). The watershed is famous for beautiful river valley that is very fertile for agriculture and therefore known as Rice Bowl of Kumaun. It has an average elevation of about 1440 meters. The watershed area consists of 18 Gram Panchayats and 33 villages. Its total population is 10,441 (Census of India, 2011). Languages spoken are Kumaoni and Hindi. The climate of the watershed area is sub-tropical and monsoon type. The main stream of watershed is Sai River which flow from west to east and it joins Kosi at Someshwar.
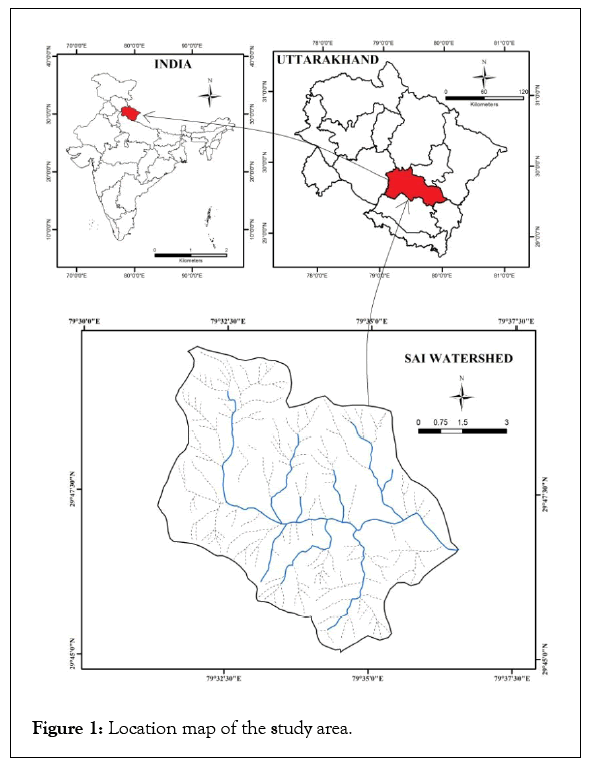
Figure 1: Location map of the study area.
Results and Discussion
The Himalaya has been greatly affected by change in land-use, the deforestation of steep hill slopes, accelerated of soil erosion and landslides. The Sai is a non-glacial river with perennial and non- perennial streams. The Sai is also a mountain watershed which is the focal unit of environmental management for sustainable development. In present, continuous extraction and utilization of resources behavior of human beings within the watershed area are closely related with the broad level of man-environmental interrelationship. GIS is an important geographical tool for management and planning that helps in preparation and analysis of various thematic map including relief, slops, aspects and ensures strategies for hydrological control and watershed management which influences all physical and human phenomenons.
Preparation and analysis of various thematic maps
Within the watershed overlays of land and topography direction and length of overland flow map could be prepared by GIS software which that it is very easy and fastest tool for analysis and preparation of such maps:
Base map: Base map of the Sai Watershed was prepared by using Survey of India topographic maps. All the perennial and non- perennial rivers, villages, road network, agricultural land, barren land, forest land and river bed area were taken into consideration.
GIS helps in identification of Watershed area/size which decides the runoff volume to classification of land use which is helpful to understand drainage infiltration, water generating capacity and groundwater recharge. The importance of the drainage shape is to decide the flood peek runoff volume time at the out let (Figure 2).
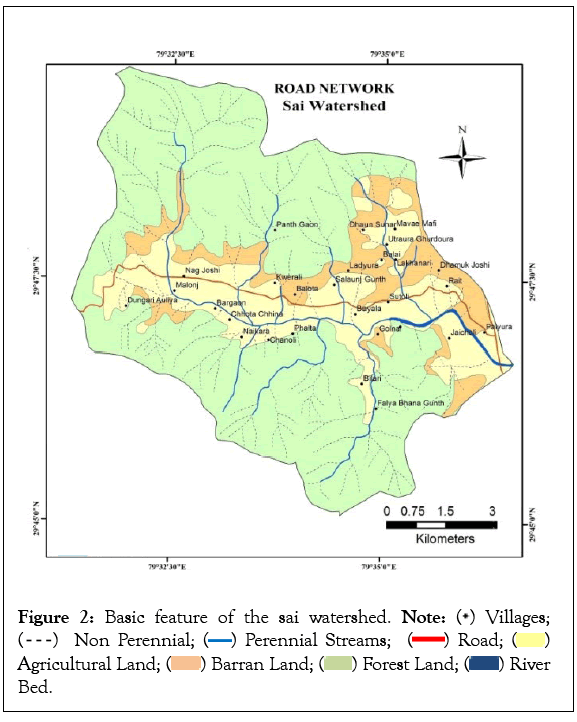
Figure 2: Basic feature of the sai watershed.

 Bed.
Bed.
Drainage map: This is another important factor which influences the watershed behavior. A large drainage density (length of drainage channels per unit area) creates situation conducive for quick disposal of runoff down the channels. In watershed where drainage density is less overland flow is predominant. Length of the channels can be derived using the digitized drainage in GIS environment.
River is very important agent of geomorphic processes and landform which up to a certain level determines land use cover, patterns, flow characteristics and erosion behaviour. There are more than 28.50 km. total length of Perennial streams and 95.78 km. Length of Non-perennial streams which are joining Sai River at different altitudes. The Sai watershed area is beneficial for developing villages near the river bed, river terrace or agriculture irrigation and animal husbandry. The drainage map is delineated by DEM and the length of drainage is measured by Arc GIS tool which presents attribute data such as main and tributary river names, villages’ names, origin, types (perennial and non-perennial), length (Figure 3).
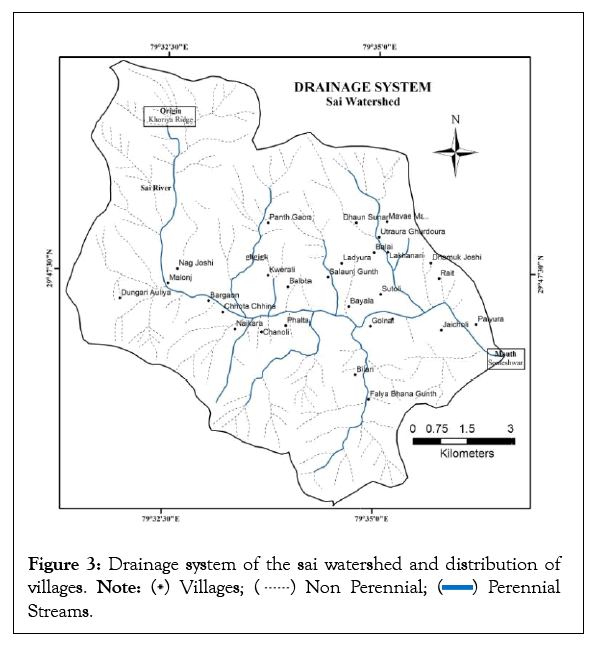
Figure 3 Drainage system of the sai watershed and distribution of villages. Streams.
Relief map: The watershed is a land of a variety of relief features like rivers, mountains, valley, waterfall and river terraces etc. The area has natural resources which boost economic and ensures social wellbeing of the watershed area. Relief implies the highest and lowest elevation points in a particular region. Mountains, ridges and river valleys are elevated points of elevation and are example of low lying area. The importance of relief feature of the gentle and medium slope that are very rich and fertile soil provide diverse agriculture seasons and suitable for habitation because this area is a drainage basin. Here relief is categories in four groups with the help of GIS and with the help of different relief zones to categories different altitudinal zone which are useful in crop management, pasture or fodder development, management of forest type and their species (Table 1). Figure 4 depicts four relief zones within the watershed. Relief zone 1700 meter covers 17.64 km area and 42.61% of the total watershed area. The maximum number of twenty-three villages is covered by this group in the medium zone of the watershed area nearest to the river. This group is including low altitude area of the watershed which is beneficial for agriculture, human settlement and human activities.
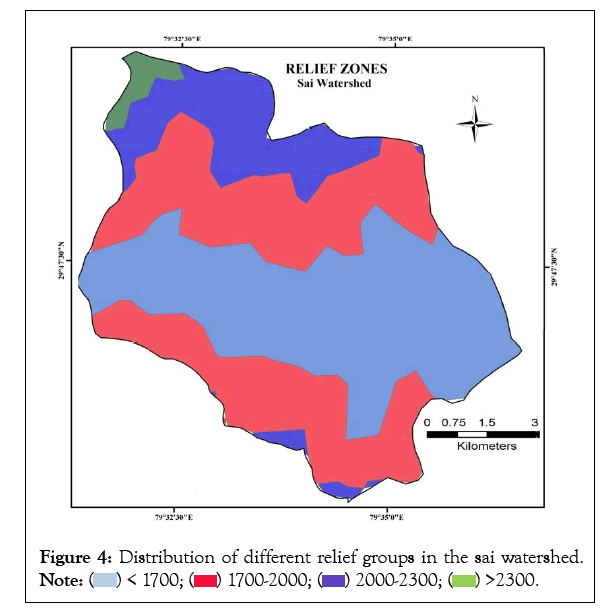
Figure 4: Distribution of different relief groups in the sai watershed.
| Altitudinal zones (in meter) | Area | Number of villages | Category of relief zones | ||
|---|---|---|---|---|---|
| in km2 | in % | in number | in % | ||
| below 1700 | 17.64 | 42.61 | 23 | 92 | Medium |
| 1700-2000 | 16.44 | 39.72 | 2 | 8 | High |
| 2000-2300 | 6.41 | 15.49 | - | - | Very High |
| above 2300 | 0.9 | 2.18 | - | - | |
| Total | 41.39 | 100 | 25 | 100 | |
Table: 1 Distribution of area under different altitude zone of the sai watershed.
Second relief zone 1700 meter-2000 meter has 16.44 km area and 39.72% of the total watershed area. Two villages lie in this zone. This group is included in high altitude area, where maximum villages suffer with migration problem due to education, better job opportunities; distance to transport and market. In present settlements are growing near the river bed, river terrace, old flood plain near Someshwar along road network which mostly liner pattern spread along Ranikhet-Dwarahat-Someshwar highway. The major causes of these growing villages are connectively to agricultural land, internet, telecommunication, transporting moter road, market shop and other services. Someshwar town is most rapidly growing town of Almora district because of terrace farming which is worldwide famous for beautiful river valley and surrounding areas full natural beauty, agriculture and river valleys.
Third relief zone (2000 meter-2300 meter) has 6.41 km. area and 15.49% of total watershed area located above 2300 meters covers 0.90 km area and 2.18% of the total watershed area. No permanent settlements are found in this zone. This zone is located in very high altitudinal zone of watershed which is beneficial for forest cover, pasture land, fodder and barren land.
Slope and slope aspect map: Slope and slope aspect affects the time of concentration, infiltration opportunity time, runoff and soil loss a particular area. Slope is an important component of geomorphology which is responsible for the geomorphic processes as geomorphic processes and landform are influenced by slope gradient or angle. Slope can be derived in GIS environment using by DEM data. Using the watershed boundary, the weighted average slope of the watershed can be derived in a GIS environment. The main contribution of slope is that it controls the rainfall or runoff distribution and movement. GIS can assist in identifying different slope groups and other hotspot areas for resource conservation and rehabilitation through examining the steepness and angle of slope which are identifying areas at disaster and hazard risk zone for landslide, debris flow, earth flow, rock fall, forest fire etc. within a watershed.
Slope map for the Sai watershed prepared by using Digital Elevation Model (DEM). Figure 5 depicts the distribution of surface slope within the watershed. Table 2 shows the distribution area under different Slope groups in the Sai watershed which are important for watershed management. A brief account of spatial distribution of the Slope groups of the Sai watershed is presented in the following are: Very gentle slope, gentle slope, moderate slope, moderate high slope, high slope, very high slope (Table 2).
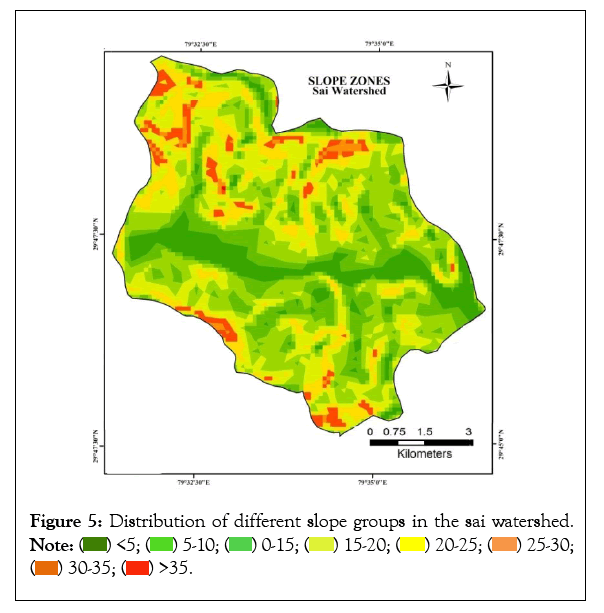
Figure 5: Distribution of different slope groups in the sai watershed.

| Slope | Area | Village | Remarks | ||
|---|---|---|---|---|---|
| Groups (in 0) | in km2 | in % | in number | in % | |
| <5 | 4.57 | 11.4 | 6 | 24 | Very gentle |
| 05-Oct | 7.44 | 17.98 | 5 | 20 | Gentle |
| Oct-15 | 11.94 | 28.84 | 6 | 24 | Moderate |
| 15-20 | 9.89 | 23.9 | 3 | 12 | Moderate high |
| 20-25 | 5.25 | 12.69 | 4 | 16 | High |
| 25-30 | 0.45 | 1.08 | 1 | 4 | Very high |
| 30-35 | 1.78 | 4.3 | - | - | - |
| >35 | 0.07 | 0.17 | - | - | - |
| Total | 41.39 | 100 | 25 | 100 | - |
Table: 2 Distribution of area under different slope groups of the sai watershed.
1. Very gentle slope class covers all those part of the watershed where the slope ranges in between 0 ° to 5 °. Six villages are covered by this group in the low zone of watershed and lower course of river upto the mouth of the river fall under gentle slope. In this Group 4.57 km2 and 11.4% of the total watershed area is included. It is characterized by the flat valley, which obviously covers areas suitable for the agriculture, market zone and transportation purposes.
2. In gentle slope, the slope angle measures between 50 ° to 150 ° in these areas of gentle slope which, includes 19.38 km2 and 46.82% of the total watershed area. Five villages covered by this group in the watershed. It extends up to upper valley of watershed.
3. Moderate slope includes all those parts of the watershed where the slope ranges 15 ° to 25 °. In this group the total area is 15.14 km2 and 36.59% of the total watershed area. The six villages covered by this group in the watershed. It is associated mountainous uplands, crests of the range and intermediate part of the mountain ranges.
4. Moderate high slope ranges between 25° to 30° categories which included the 0.45 km2 and 1.08% of the watershed area. Three villages are found in this zone.
5. High slopes are very sensitive for rock fall, debris fall, landslide and other mass wasting processes. As high slope corresponds high relief and relatively hard bed rocks are found them. Here the slope ranges between 30° to 35° and it includes 1.78 km2 and 4.30% of the total watershed. Four villages are found in this zone.
6. Very high slope includes all those part of the watershed where the slope ranges 35° to 40°. Only 0.07 km2 and 0.17% part of the total watershed falls under the region of very high slopes where the slope ranges above 35 ° such patches of steep slope are mainly distributed small patches in Bhatneshwar and Udhepur forest. One village is located in this zone.
Slope aspect: Aspect map for the watershed is prepared by using Digital Elevation Model (DEM). It is characterized by direction of surface and mountain slope which is important in Agricultural crop planning. The aspect has influencing on local climate directly and indirectly. It has strong influence on temperature which is useful for human settlement and growing of natural vegetation. Figure 6 depicts the distribution of aspect within the watershed. Table 3 shows the distribution area under different aspect groups in the watershed.
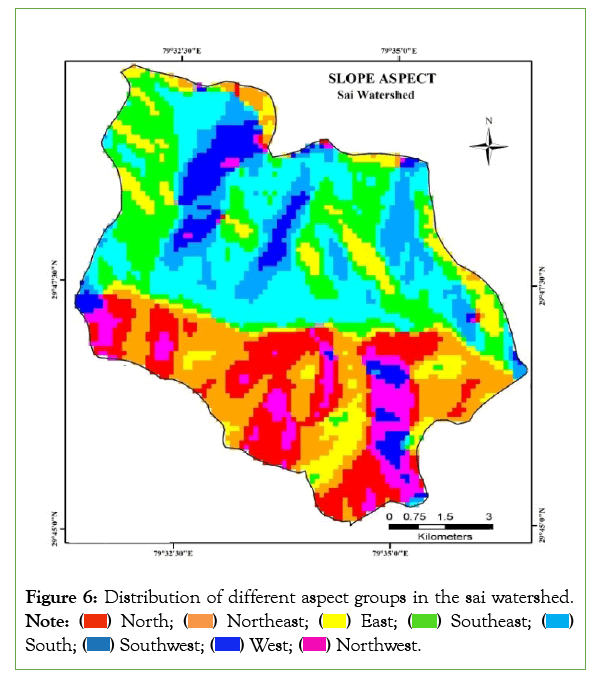
Figure 6: Distribution of different aspect groups in the sai watershed.

| Aspect Name | Area | Number of villages | ||
|---|---|---|---|---|
| in km2 | in % | in number | in % | |
| N | 5.22 | 12.61 | 5 | 20 |
| NE | 5.86 | 14.16 | - | - |
| E | 5.98 | 14.45 | 1 | 4 |
| SE | 8.79 | 21.23 | 7 | 28 |
| S | 5.28 | 12.76 | 5 | 20 |
| SW | 3.14 | 7.59 | 4 | 16 |
| W | 2.86 | 6.9 | 2 | 8 |
| NW | 4.26 | 10.3 | 1 | 4 |
| Total | 41.39 | 100 | 25 | 100 |
Note: N: North; NE: North-East; E: East; SE: South-East; S: South; SW: South-West; W: West; NW: North-West.
Table: 3 Distribution of area under different aspect groups of the sai watershed.
A brief account of spatial distribution of the aspects groups of the watershed is presented in the groups are North, North-East, East, South-East, South, South-West, North-West and West (Table 3). The largest area covered by the South-East portion which is 8.79 km2 and 21.23% of the total watershed area and maximum number of villages is found in this group which is seven villages out of twenty-five. The lowest area covered by the West portion which is 2.86 km2 and 6.90% of the total watershed area and two villages found in this group.
Land use/land cover map: Land cover defined as the assemblage of biotic and abiotic components on the Earth’s surface is one of the most crucial properties of the Earth system. Its refers to the physical phenomena of earth’s surface, captured in the distribution of vegetation, water bodies, different land pattern and other physical feature of the land including those created solely by human activities e.g. settlements, industries, transportation network and canal. Land use/cover is two separate terminologists which are often used interchangeably [9]. The land use/land cover map of the present area is prepared in Figure 7. Four broad categories of land use are identified and mapped in the watershed. They are agricultural land, barren land, forest land, river bed. The built-up land or settlements are included in agricultural land. Existing land use and cover conditions including agriculture land, forest land, barren land and river bed, built-up land which are derived using GIS tool and ground truth. The effective application of GIS in land-use are monitoring and simulating of the agricultural and forest land its effects on land use pattern and water resources planning and management. The land-use and land cover map is useful in watershed area are: increase in horticultural and forest plantation; promotes economic and social development of village level and effective in agricultural farming; information of species gives a sure ground for selection plant and crops; sustainable use of land such as built-up, barren land and wetland etc.
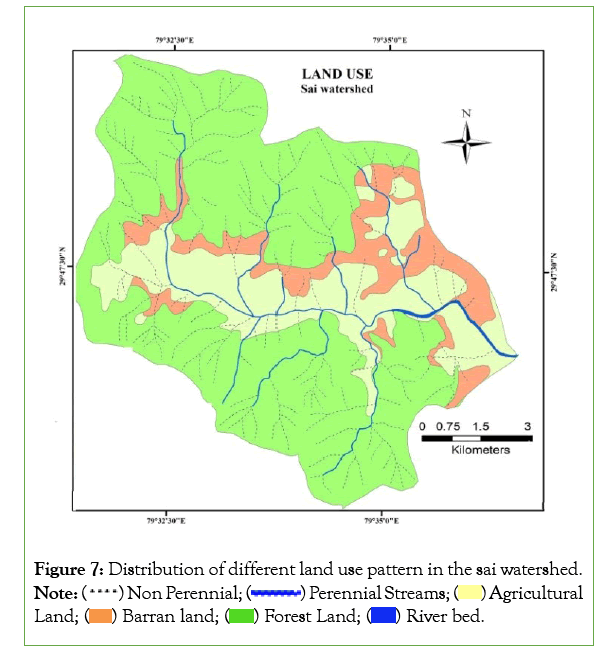
Figure 7: Distribution of different land use pattern in the sai watershed.

The land-use/land-cover distribution of watershed is derived from the map are presented by GIS (Table 4) (Figure 7). The total land-use of the watershed is 41.39 km2. The land-use categories of watershed are four which are agricultural land, barren land, forest land and river bed land. The land-use of watershed is basically refers to river because all these categories are developed on linear pattern along the river and road network. Agriculture land is cover maximum land of the total land-use of watershed which is 27.17 km2 and 65.66%. Twenty-one villages of watershed are found in this category. The agricultural land is found both side of river bank in terrace form. It is mainly found lower zone of river and middle part of the watershed. The forest land is mostly dominated in the North North-East, North-West, South and South East part of the watershed which account is 9.06 km2 and 12.11% of the total area which are found one village. The main cause of found maximum villages in forest area because the pattern of land-use is based on land zone such as agriculture in lower zone than settlement in middle zone and forest, pasture and fodder in high zone. Barren land cover is 5.01 km2 and 12.11% of the total area which are found three villages. It is mainly dominated in the central part of the watershed. The last category of river bed is 0.14 km2 and 0.34% where no found any village.
| Type of land use | Area | Villages | ||
|---|---|---|---|---|
| in km2 | in % | in number | in % | |
| Agriculture | 27.17 | 65.66 | 21 | 84 |
| Barren | 5.01 | 12.11 | 3 | 12 |
| Forest | 9.06 | 21.89 | 1 | 4 |
| River bed | 0.14 | 0.34 | N.A | - |
Table 4: Area under different land use/land covers area categories of the sai watershed.
The various thematic maps like location map, base map, drainage map, slope map, relief map, aspect map and land use/land cover map are prepared using GIS techniques and are shown in Figures 1-7.
Watershed management:
Watershed management basically refers to analysis, protection, repair, utilization and maintenance of watersheds for optimum control and conservation of land and water with due regard to various other resources [10]. It refers to efficient management and conservation of surface and groundwater resource. It includes conservation, regeneration and judicious use of all natural resources (land water, plants and animals etc.) and humans within a watershed. It brings about the balance between natural resource and society. It may be detained as the management of all natural resources for sustainable crop productivity along with socio-economic improvement of people living in rural areas. The watershed management approach has emerged as a holistic and integral way of research, analysis and decision-making at a watershed scale [11-13]. Watershed management is a term used to describe the process of implementing land use practices and water management practices to protect and improve the quality of the water and other natural resources within a watershed by managing the use of those land and water resources in a comprehensive manner [14]. The concept of Watershed Management is as the sentiments of the people living within the watershed area have to be given utmost priority in implementing various watershed management schemes [15,16].
The aims of Sai watershed management are to control damaging runoff, erosion, sediment yield and flash flood, enhance groundwater level, use of land resources optimally to protect, conserve and improve land and land-use pattern. The main initiative objectives are conservation and management of traditional and modern water resources such as Naula, Dhara, percolation tank, dug out pond, hand pump and construct check dams and rainwater harvesting. GIS is helpful in watershed management are delineation of watershed, surface water inventory, thematic mapping for identification and analysis, slope evaluation for water conservation and land-use planning, searching and monitoring of water body, barren land, agriculture land and forest land. It is useful in estimation of soil erosion, rainfall runoff modeling, flood, crop and irrigation of water management. All these objectives are importance of famers for his crop planning making, irrigation monitoring, policy makers and soil conservationist and scientists which is role play in regional planning and people are also participate at micro level.
Conclusion
In present scenario GIS is used in crop classification, rainfall distribution, surface water inventory, thematic and plan mapping, resource conservation, searching and monitoring of water percolation tanks, dug out ponds, check dams, rain water harvesting and strategies for watershed management. GIS is useful for watershed development mapping such as base map, geological map for the purpose of rock and soil type, rainfall data, elevation, population, groundwater chemical concentrations, monitoring of main and sub-stream and some traditional water resources create the strategies for drinking water, hydro-power production, agriculture irrigation, fisheries and animal husbandry and water conservation in the Sai watershed area. Sai is a micro level watershed which is helpful for their physical environment and human being by GIS. It is an important role play in land-use and non-perennial stream management.
References
- Leopold, LB, Woman MG, Miller JP. Fluvial processes in geomorphology. 1964:1-522.
- Curry RR. Watershed form and processes the elegant balance. The Coevolution Quarterly, 1976;10-16(2):14-21.
- Myers G. Healing the land: The redwood creek renewal project. The Coevolution Quarterly, 1976:10-16(2):74-77.
- Warshall P. Streaming wisdom. The Coevolution Quarterly. 1976:10-16(2):4-10.
- Simon DB, Li RM, War JT, Shimao YL. Modelling of water and sediment yields from forested drainage basins. Metric Equivalents. 1982.24.
- Cox NJ. In sediment budget and routing in forested drainage basin, Swanson et al. (Eds.), U.S. Department of agriculture forest service, Pacific Northwest forest and range experiment station general technical report PNW-141. 1982:165.
- Chorley RJ. The drainage basin as a fundamental geomorphic unit. Introduction reduction to Fluvial Processes. 1969:30-52.
- Lee R. Potential insolation as a topoclimatic characteristic of drainage basins. Hydrol Sci J. 1964;9(1):14-30.
- Gergory KJ, Walling DE. Drainage basin form and processes: A Geomorphological approach. Edward Arnold Ltd. Great Britain. 1973:458.
- Dimyati M, Mizuno K, Kobayashi S, Kitamura T. An analysis of land use/cover change in Indonesia. Inter J Rem Sen. 1996;17(5):931-944.
- Rawat SM. Environment geomorphology and watershed management: A study from Central Himalaya. Concept Publishing Company. 1990:286.
- Montgomery DR, Grant GE, Sullivan K, Watershed analysis as a framework for implementing ecosystem management. Water Res Bull. 1995;31(3):369-386.
- Perciasepe R. EPAs watershed approach to ecosystem management. Fisheries. 1994;19(4):4-5.
- Voinov A, Costanza R. Watershed management and the Web. J Environ Manag. 1999;56(4):231-245.
- Meenakshi Bai R, Raghavendra RV, Rajesh V. Application of remote sensing and GIS techniques in watershed management. Res J Chem Environ Sci. 2018;6(5):1-4.
- Vanishing the Earth. An International Broadcasting Trust Viewers guide to the BBC/TVE Co-Production. 1987;4-5.
Citation: Kaira P, Pant NC, Joshi J (2023) Applications of Geo-informatics in Watershed Management: A Case Study from Sai Watershed in Kumaun Himalaya, Uttarakhand. J Remote Sens GIS.12:302.
Copyright: © 2023 Kaira P, et al. This is an open access article distributed under the terms of the Creative Commons Attribution License, which permits unrestricted use, distribution, and reproduction in any medium, provided the original author and source are credited.
