
Indexed In
- Academic Journals Database
- Open J Gate
- Genamics JournalSeek
- JournalTOCs
- China National Knowledge Infrastructure (CNKI)
- Scimago
- Ulrich's Periodicals Directory
- RefSeek
- Hamdard University
- EBSCO A-Z
- OCLC- WorldCat
- Publons
- MIAR
- University Grants Commission
- Geneva Foundation for Medical Education and Research
- Euro Pub
- Google Scholar
Useful Links
Share This Page
Open Access Journals
- Agri and Aquaculture
- Biochemistry
- Bioinformatics & Systems Biology
- Business & Management
- Chemistry
- Clinical Sciences
- Engineering
- Food & Nutrition
- General Science
- Genetics & Molecular Biology
- Immunology & Microbiology
- Medical Sciences
- Neuroscience & Psychology
- Nursing & Health Care
- Pharmaceutical Sciences
Research Article - (2023) Volume 14, Issue 5
Analysis of COVID-19 Vaccination Effectiveness
Tomaž Makovec, Amrit Srečko Šorli*, Rado Gorjup, Živan Krevel and Sebastijan Piberl2Department of Medical Sciences, Bijective Physics Institute, Idrija, Slovenia
3Department of Medical Sciences, ITR-Institute for Trans-disciplinary Research and Development, Slovenia
4Department of Medical Sciences, Homeopathic Center Krevel, Ivancna Gorica, Slovenia
5Center for Quantum-Information Medicine and New Technologies in Medicine, Maribor, Slovenia
Received: 22-May-2023, Manuscript No. JVV-23-21396; Editor assigned: 24-May-2023, Pre QC No. JVV-23-21396 (PQ); Reviewed: 09-Jun-2023, QC No. JVV-23-21396; Revised: 16-Jun-2023, Manuscript No. JVV-23-21396 (R); Published: 27-Jun-2023, DOI: 10.35248/2157-7560.23.14.530
Abstract
Global research on the COVID-19 vaccination effectiveness is using methods that are misleading the scientific community and public opinion. There is a basic standard in medicine: To measure the effectiveness of an experimental medicine, we need to have two groups. The group that will take medicine and the group that will not take medicine. We follow the health status of both groups for a few months, and will get objective results. This is the only proper methodology to verify the effectiveness of a new medicine. Articles cited from 1-5 did not use the basic standard. They develop different kinds of methodologies that all have no statistical significance. On the basis of their methodologies, they conclude that COVID-19 vaccines have a positive effect on public health. By comparing graphs of the intensity of vaccination and the rate of mortality, we see that after the period of intense vaccination follows the period of higher excess mortality. Basic statistical data are confirming that COVID-19 vaccines increased the mortality rate.
Keywords
COVID vaccination; Mortality rate; Statistics; Analysis; Public health
Abbreviations
RABV: Rabies Virus; EMA: European Medicines Agency; VAERS: Vaccine Adverse Event Reporting System
Introduction
The high excess mortality caused by the COVID-19 virus in 2020, prompted the world’s medical system under the supervision of the WHO, to start a massive vaccination campaign end of 2020 and at the beginning of 2021, with the aim to reduce excess mortality. Several articles’ conclusions are that COVID-19 vaccines decreased mortality [1-5]. Their research methods are not appropriate and do not use basic standards of science, namely, the efficacy of a massive vaccination can only be measured by comparing the death rate of the vaccinated population with the death rate of the non-vaccinated population, the latter being the control group. Recently this research was done and it has confirmed that the vaccinated part of the global population has an increased mortality rate of about 14.5% with respect to the non-vaccinated population cohort [6].
Methodology
In the research methodology we use, every element in the model corresponds to exactly one element in physical reality. The world is set X with n elements, and the model of the world is set Y with n models. Every element in set X has exactly one correspondent element in set Y. In physics, this methodology has given excellent results. It can also be applied in statistics and big data analysis. The entire population in a given country is set A, it has two subsets, set vaccinated and set non-vaccinated. In the set vaccinated, people are protected from COVID-19 and should have a smaller mortality rate than people in the set of non-vaccinated. This means in set A, the subset non-vaccinated will be the main source of excess mortality (Figure 1).

Figure 1: Set A, subset vaccinated, and subset non-vaccinated.
With the increase of vaccination in a given time period the subset of vaccinated is increasing and the subset of non-vaccinated is decreasing. This means the more people are vaccinated the lower should be the mortality rate. In time with the massive vaccination, the mortality rate in set A should decrease. This hypothesis was checked by comparing the graphs of the number of daily vaccinations and the graphs of the mortality rate. The more people were vaccinated in a given time period the smaller should become the mortality rate in the following time period. This analysis of data was done for several states of the United States.
Results
Our method is the analysis of the graphs of the intensity of vaccination and graphs of the mortality rate. The sources of data are the following: Our world data is used to get the number of daily administered doses per 100 people (Figure 2) [7].

Figure 2: Excess mortality and number of daily vaccinations in USA. Note: ( ) Baseline; (
 ) Normal range; (
 ) Substantial increase.
These are graphs on the left. US Morality data are used to see the excess mortality rate over time [8]. These are graphs on the right. The dark on the left spot is the begging of vaccination on 31 December 2020 when excess mortality was at its peak. With the increase in vaccination that reached its peak on 13 April 2021, the mortality rate has decreased. The green spot is the minimum vaccination on 10 July 2021. With the increase in vaccination from 10 July 2021 to 31 January 2022 (from green to the red spot on the left) mortality rate reached its peak on 31 January 2022. The black arrow on the left is an intense vaccination period. The black arrow on the right is the period of high excess mortality that culminated at the end of intense vaccination on 31 January 2022. With the decrease in vaccination (from red point to violet point) the mortality rate also decreased. The violet spot on both sides is on 26 March 2022 (Figure 2, United States of America).
The positive correlation between vaccination and mortality rate in the sense that vaccines diminished mortality rate in the first month of vaccination is also characteristic in some other countries. The USA is an exception in the sense that in all other countries, this positive correlation lasted only to the end of March 2021 (Figure 3).

Figure 3: Excess mortality and number of daily vaccinations in Alabama. Note: () Baseline; () Normal range; () Substantial increase.
The black arrow on the right is represents intense vaccination in March and April 2021. The black arrow on the right is the stable mortality in April and May 2021. The brown arrow on the left is intense vaccination in March and April 2021. The brown arrow on the right is the intense excess mortality in April and May 2021. The red arrow on the left is 31 January 2022 after intense vaccination. The red arrow on the right is the peak of excess mortality on 31 January 2022 (Figure 3, Alabama).
Data from the state of Alabama confirm that when vaccination in a given period was intense the mortality rate increased in the following period. It should be the opposite, after intense vaccination in a given period mortality rate in the following period should decrease. Figure 2 indicates that with massive vaccination, the mortality rate of the population is increasing. An analysis of several states of the US will show if Figure 2 is an exception or rule.
For Alaska, graphs do not show a significant causal correlation between the intensity of vaccination in a given period and the mortality rate in the following period (Figure 4).

Figure 4: Excess mortality and number of daily vaccinations in Arizona. Note: () Baseline; () Normal range; () Substantial increase.
The black spot on the left and right is the beginning of vaccination on 13 January 2021. The red spot on the left and right is the peak of vaccination on March 31. The red arrow on the left indicates the end of intense vaccination on July 12. The red arrow on the right indicates the peak of mortality on the day of July 12. The blue arrow on the left indicates the end of intense vaccination on the day of 12 September. The blue arrow on the right indicates the peak of excess mortality on the day of September 14. The green spot on the right is the end of intense vaccination in 2022 on March 21, and the green spot on the right is the end of the period of excess mortality in 2022 on Mach 21. The black arrow on the left is the end of massive vaccination on the day November 28 in 2002. The Black arrow on the right is the peak of mortality on November 28 in 2022 (Figure 4, Arizona).

Figure 5: Excess mortality and number of daily vaccinations in Arkansas. Note: () Baseline; () Normal range; () Substantial increase.
The blue arrow on the left is the end of the massive vaccination on 21 January 2021. The blue arrow on the right is the peak of mortality on 18 January 2021. The red arrow on the left is the peak of the period of intense vaccination on 9 August 2021. The red arrow on the right is the peak of excess mortality on 9 August 2021. The green arrow on the left is the end of intense vaccination on 31 January 2023. The green arrow on the right is the peak of excess mortality on 7 February 2023 (Figure 5, Arkansas).

Figure 6: Excess mortality and number of daily vaccinations in California. Note: () Baseline; () Normal range; () Substantial increase.
The black arrow on the left and right is 11 July 2021. The horizontal black arrow on the left is intense vaccination in December 2021 and in January 2022. The horizontal red arrow on the right is a period of excess mortality in January and February 2022 (Figure 6, California).

Figure 7: Excess mortality and number of daily vaccinations in Colorado. Note: () Baseline; () Normal range; () Substantial increase.
The black arrow on the left is the intense vaccination in November and December 2021. The red arrow on the right is a period of intense excess mortality in November and December 2021 and January 2022. In general, after the period of intense vaccination, the excess mortality rate should decrease because people should have been protected from COVID-19. In general, the result is the opposite (Figure 7, Colorado). (Figure 8).

Figure 8: Excess mortality and number of daily vaccinations in Connecticut. Note: () Baseline; () Normal range; () Substantial increase.
The horizontal black arrow on the left is intense vaccination in November and December 2021 and January 2022. The horizontal red arrow on the right is the period of excess mortality in December 2021 and January 2022. The thin red arrow on both sides is 25 March 2022 (Figure 8, Connecticut).

Figure 9: Excess mortality and number of daily vaccinations in Delaware. Note: () Baseline; () Normal range; () Substantial increase.
The horizontal black arrow on the left is intense vaccination in December 2021. The horizontal red arrow on the right is the period of excess mortality in January 2022. The thin red arrow on both sides is 1 April 2022 (Figure 9, Delaware).

Figure 10: Excess mortality and number of daily vaccinations in Columbia. Note: () Baseline; () Normal range; () Substantial increase.
The horizontal black arrow on the left is intense vaccination in December 2021. The horizontal red arrow on the right is the period of excess mortality in January 2022. The thin red arrow on both sides is 15 February 2022 (Figure 10, Columbia).

Figure 11: Excess mortality and number of daily vaccinations in Florida. Note: () Baseline; () Normal range; () Substantial increase.
The horizontal black arrow on the left is intense vaccination in December 2021. The horizontal red arrow on the right is the period of excess mortality in January 2022. The thin black arrow on both sides is 30 March 2022 (Figure 11, Florida). (Figure 12).

Figure 12: Excess mortality and number of daily vaccinations in Georgia. Note: () Baseline; () Normal range; () Substantial increase.
The red arrow on the left is 30 August 2021 after intense vaccination. The red arrow on the right is a peak of the intense mortality period on 6 September 2021. The horizontal black arrow on the left is intense vaccination in January 2022. The horizontal red arrow on the right is the period of excess mortality in January and February 2022. The thin green arrow on both sides is 30 March 2022 ((Figure 12, Georgia).

Figure 13: Excess mortality and number of daily vaccinations in Hawaii. Note: () Baseline; () Normal range; () Substantial increase.
The black arrow on the left is intense vaccination between 12 December 2021 and 20 January 2022. The red arrow on the right is the period of intense excess mortality rate between 14 January 2022 and 14 February 2022. The green arrow on both sides is 2 April 2022 (Figure 13, Hawaii).
For Idaho, graphs do not show a significant causal correlation between the intensity of vaccination in a given period and the mortality rate in the following period (Figure 14).

Figure 14: Excess mortality and number of daily vaccinations in Illinois. Note: () Baseline; () Normal range; ( ) Substantial increase.
The horizontal arrow on the left is intense vaccination in November, December 2021, and January 2022. The horizontal arrow on the right is a period of excess mortality in December 2021, January 2022, and the first two weeks of February 2022. The slanted arrow on the left is 10 Mach 2022, it represents the end of intense vaccination. The slanted arrow on the right is 10 Mach 2022 and represents the end of the period of intense excess mortality (Figure 14, Illinois).

Figure 15: Excess mortality and number of daily vaccinations in Indiana. Note: () Baseline; () Normal range; () Substantial increase.
The vertical arrow that points down on the left is 10 December 2021. The vertical arrow that points down on the right is 13 December 2921. The vertical arrow that points up on the left is 12 January 2022. The vertical arrow that points up on the right is 15 January 2022. The round spot on the left is 31 March 2022. The round spot on the right is 31 March 2022 (Figure 15. Indiana).

Figure 16: Excess mortality and number of daily vaccinations in Iowa. Note: () Baseline; () Normal range; () Substantial increase.
The dark arrow on the left is active vaccination in October, November, and December 2021, and the first five days of January 2022. The red arrow on the right is the period of high mortality from 25 October 2021 to 21 January 2022. The green arrows on both sides are on 14 March 2022 (Figure 16, Iowa).

Figure 17: Excess mortality and number of daily vaccinations in Kansas. Note: () Baseline; () Normal range; () Substantial increase.
The dark arrow on the left is active vaccination in November, and December 2021. The red arrow on the right is the period of high mortality in January 2022 and the first two weeks of February 2022. The green arrow on both sides is 4 April 2022 (Figure 17, Kansas). (Figure 18).

Figure 18: Excess mortality and number of daily vaccinations in Kentucky. Note: () Baseline; () Normal range; ( ) Substantial increase.
The first black arrow on the left is intense vaccination in August 2021. The first red arrow on the right is the intense high mortality from 15 August to 15 October 2021. The second black arrow on the right is intense vaccination in December 2021. The second red arrow on the right is a period of excess mortality from 15 January 2022 to 15 February 2022. The green arrow on both sides is 27 October 2021. The red arrow on both sides is 21 March 2022, it shows the end of intense vaccination and the end of excess mortality (Figure 18, Kentucky).
Our research has confirmed that intense periods of vaccination are followed by periods of higher excess mortality. Our previous research has also confirmed that after intense vaccination with boosters, the mortality rate has increased. The method we use is significant because it confirms that massive vaccination has increased the mortality rate.
Discussion
We analyzed research methodologies of articles that are claiming COVID vaccines are saving lives. The article “Global impact of the first year of COVID-19 vaccination: a mathematical modelling study” published in a journal of year 2022 is claiming that COVID vaccination saved 14.4 million lives worldwide: “COVID-19 vaccination has substantially altered the course of the pandemic, saving tens of millions of lives globally. However, inadequate access to vaccines in low-income countries has limited the impact in these settings, reinforcing the need for global vaccine equity and coverage” [9].
Authors said that this study has added values: “This mathematical modelling study advances previous work both in terms of scale (number of regions modeled) and in terms of quantifying both the direct and indirect impact of COVID-19 vaccination globally. We estimated the impact of vaccination up to Dec 8, 2021, by fitting COVID-19 transmission models to both reported deaths and excess mortality during the pandemic as a proxy for deaths due to COVID-19”. This article attempts to calculate how many people would die because of the COVID-19 virus if there would be no mass vaccination program, in other words, how many people’s lives were saved with COVID vaccines. The human population worldwide is depicted below as a set A that has N elements. The COVID-19 virus endangered all these elements’ lives. With the vaccination entire population that is set A was divided into two subsets, a subset vaccinated and a subset non-vaccinated, see Figure 1. The authors only address the “SUBSET vaccinated”.
Their results are as follows: “Based on our model fit to officially reported COVID-19 deaths, we estimated that 18.1 million (95% Credible Interval [CrI] 17.4–19.7) deaths due to COVID-19 would have occurred without vaccinations worldwide during the first year of the COVID-19 vaccination program (Dec 8, 2020, to Dec 8, 2021). Of these, we estimated that vaccination prevented 14.4 million (95% CrI 13.7–15.9) deaths due to COVID-19, representing a global reduction of 79% of deaths (14.4 million of 18.1 million) during the first year of COVID-19 vaccination. These estimates of vaccine impact do not account for the potential underascertainment of deaths related to COVID-19”.
In the entire article, the authors completely avoided how “SUBSET non-vaccinated” managed the COVID-19 virus. They divided the human population into two parts and thus, make conclusions for both parts. The Watson et al quantitative model suggests 14.4 million lives were saved worldwide, without including the nonvaccinated part of the human population in their calculations. There is a general rule in science, that one cannot make conclusions about something that one did not include in oneâ??s research. Researchers have excluded the non-vaccinated part of the human population. It might be the case, at least with some non-immunized cohorts; this segment has managed better with the COVID-19 virus due to natural immunity and has remained non-compromised. This possibility that should have been taken into account has been automatically excluded by the authors. They just assume that the vaccinated part of the population was better protected than the unvaccinated part of the population, without having data proving their hypothesis.
In general, we do not have substantial clinical results to prove that COVID vaccines are saving lives. This is still a working hypothesis, so the opposite is also possible. COVID vaccines could also save the lives of the non-vaccinated group and take the lives of the vaccinated group. While there is an accumulation of data pointing to vaccination benefits many of these claims are based on flawed observational data packaged and presented to bolster the mass vaccination case. A historically unprecedented large number of serious side effects captured in VAERS suggest this alternative is also open and should be evaluated. To see if this is true the unvaccinated group should also be taken into elaboration just like the vaccinated group. For both groups, the same mathematical model should be used. They could calculate for example the Mortality Rate (MR) for the year 2021 of both groups in percentage:
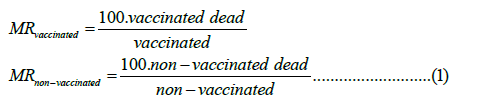
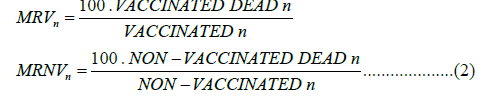
Using this mathematical model, both groups would be equally examined and this is the only way to get objective results. According to their narrative, the mortality rate of MR vaccinated should be much lower than the mortality rate of MR unvaccinated. To get highly precise results both groups should be divided into five age groups (0-20, 21-40, 41-60, 61-80, +80) and calculations should be done for each age group. In general, the older population was more vaccinated than the younger population and older people die more frequently than younger. Calculating mortality rate in percentage for each age group separately, the Simpson effect is excluded (Table 1).
| Age group | MR vaccinated | MR non-vaccinated |
|---|---|---|
| 0-20 | MR V1 | MRNV1 |
| 21-40 | MR V2 | MRNV2 |
| 41-60 | MR V3 | MRNV3 |
| 61-80 | MR V4 | MRNV4 |
| +80 | MR V5 | MRNV5 |
Table 1: Age groups for calculation of mortality rate in percentages.
We have several methods in statistics for equal evaluation of the impact of COVID vaccination on both groups [6]. In general, the basic standard is that the non-vaccinated group is serving as a control group which is compared with the vaccinated group. But what is not acknowledged in the countless journals praising the mass vaccination program is that a majority of the research that addresses COVID vaccine effectiveness lacks anything near the basic standard. The focus is only on how vaccines have helped the vaccinated group. The non-vaccinated group is excluded from their evaluation which is a huge failure in the research methodology that makes their results highly unreliable and useless.This article does not consider the basic rules of scientific methodology, in this case, is the following: “When we study a given system, we cannot divide the system into two parts, study only one part and then give conclusions about the entire system”. Authors used mathematical models that have no security mechanism; they are not self-regulating in the sense that they cannot verify their exactness. In brief, there is no control group, there is no basic standard. Their results have no statistical significance and are therefore useless and misleading.
Analysis of five-month vaccination in England has confirmed that the vaccinated part of the population has increased the mortality rate by about 14.5% [6]. Detailed analysis for the entire years 2021 and 2022 where calculations should be done for five age groups (0- 20, 21.40, 41-60, 61-80, and above 80) will give the exact increased mortality rate due to the massive COVID-19 vaccination (Table 2).
| Age group | Dead | Alive | Vaccinated |
|---|---|---|---|
| 0-20 (1) | D1 | A1 | V1 |
| 21-40 (2) | D2 | A2 | V2 |
| 41-60 (3) | D3 | A3 | V3 |
| 61-80 (4) | D4 | A4 | V4 |
| +80 (5) | D5 | A5 | V5 |
Table 2: Age groups for calculating their proportional number of vaccinated dead.
The exact mortality rate for each age group we calculate as follows:
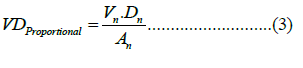
Where VDProportional is the proportional number of vaccinated dead individuals. According to our results the calculated VDProportional is always smaller than the statistical number of vaccinated dead individuals VDStatistical , which means that COVID vaccines increased the mortality rate. COVID-19 vaccines have been developed in an extremely short time and there were no necessary studies done that would clearly confirm the safety of these vaccines. If only 1000 people that were vaccinated in January 2021 would be followed up for three months and their health would be compared with the health of the control group of the same age that was not vaccinated, it would be clear by the end of April 2021 that these vaccines are hugely damaging people health and hugely increasing excess mortality rate. Why such a study was not done is a question that medical science will need to find the answer to in order to regain people’s trust.
The proof that COVID vaccines increased the mortality rate does not require high-profile scientific education. One that can compare graphs of the intensity of vaccination and excess mortality immediately understands that graphs (see graphs 2-18) are proving the direct causal correlation between the intensity of vaccination and excess mortality. There is no need for a mathematical model and calculations that would prove the fact of damage of the COVID-19 vaccination on public health. One that has eyes can observe the graphs and see the truth. A detailed mathematical analysis of these graphs can be done by using the mathematical algorithm which defines the direct causality correlation between intense vaccination and excess mortality rate.
The discussion that these vaccines are more harmful than beneficial to health is not appropriate because no convincing clinical studies were done that would prove these vaccines are effectively protecting health as, for example, ivermectin does [10]. Why the WHO did not recommend ivermectin remains an open question. One thing is certain: An organization that is 80% in private hands cannot represent the interests of global public health.
One of the conclusions of Mark Skidmore’s article is the following: “Turning to the primary hypothesis, a respondent’s observations within his/her social circles have a significant influence on the decision to be vaccinated. Those who know someone who experienced a significant health problem from the COVID-19 illness have higher odds of being vaccinated (OR: 1.309, 95% CI 1.094–1.566). Conversely, those who know someone who had a health problem following inoculation have lower odds of being vaccinated (OR: 0.567, 95% CI 0.461–0.698). The impact of COVID-19 vaccine injury is larger than the impact of COVID-19 illness” [11]. The claim that COVID-19 vaccines saved millions of lives is a myth that should be dismantled in order to protect public health.
mRNA vaccines increase the risk of neurodegenerative disease and consequently also the risk of premature death: “In light of these considerations, the risk/benefit ratio for the mRNA vaccines needs to be reevaluated. With every vaccine comes a flood of spike protein released into the circulation, further advancing the potential for amyloid genic effects and increasing the risk of future neurodegenerative disease. A comment by Kenji Yamamoto published in a scientific journal urges the medical community to keep track of the date of the most recent vaccination of hospital patients in order to be better able to assess what role the vaccine may have played in any manifest disease or condition. He also strongly discourages policy that promotes continued boosting of anyone other than the most at-risk patients to death from COVID-19. There is an urgent need for governments to reconsider a blind policy that assumes that repeated vaccine boosters are a valid approach to dealing with COVID-19” [12]. The high excess mortality in 2022 is the result of the massive COVID vaccination in 2021 that has increased the mortality rate of the vaccinated population by about 14.5%.
The possibility that COVID vaccines may increase the mortality rate is excluded from most of the scientific literature. In their narrative people are dying only because of the COVID-19 virus, the possibility to die because of undesirable effects of vaccination is automatically excluded: “The uncoupling of excess mortality and new COVID-19 cases, in the absence of decreases in the mean age of infected individuals, suggests that in our highly vaccinated state, current levels of immunity are considerable, leaving many, if not most, individuals at high risk with substantial protection against the most severe outcomes of SARS-CoV-2 infection” [13]. This approach should be proven by the adequate statistical analysis we proposed in this article. As we can see in the second chapter of this article, it is a common rule that after a period of intense COVID vaccination, a period of increased mortality rate follows. If COVID vaccines protected peopleâ??s health, the mortality rate after intense vaccination should decrease, but data show it increasing.
Researchers who study COVID vaccine’s effectiveness are not willing to calculate the excess mortality rate of the vaccinated population and excess mortality of the non-vaccinated population as it is suggested in this article and objectively evaluate the impact of COVID vaccination on the mortality rate. We are back in the Middle Ages science where the geocentric system was meant to be the exact description of planets and the sun’s motion around the Earth. All calculations were exact; nobody had a minimal doubt that the geocentric model could not be correct. Today, we have the same situation. The narrative is that COVID-19 vaccines are saving lives, but the huge numbers of heavy side effects which may lead to death, are not taken into consideration [6].
With the COVID crisis, medical science has lost the spirit of empiricism. Articles are published about the effectiveness of vaccines, which do not have a relevant mathematical model and exclude the fact that only a control group of an unvaccinated part of the population can prove the effectiveness of vaccination. Using elementary school math, we can calculate the death rate of a vaccinated subset of the population and compare it to the death rate of an unvaccinated subset of the population.
The spirit of empirical science born in the Renaissance is one of the brightest achievements of Mankind. It has taken the human race out of the dark early middle age of irrationality and superstition. The core of empiricism is the development of a mathematical description of the world that is verified with experiments.
Regarding objectivity and empiricism in medicine, we have several articles published in peer review journals that claim COVID vaccines decreased the mortality rate, and that with COVID vaccination millions of lives were saved. When we read these articles, we see that there is no empirical bond between the mathematical model and the physical reality. Authors claim that COVID vaccines helped the vaccinated part of the population and saved numerous lives, but nobody is comparing the mortality rate of the vaccinated part of the population with the mortality rate of the non-vaccinated part of the population. This comparison is the most reliable statistical method that respects the spirit of empirical science.
The only real objective reference point of COVID vaccine effectiveness is the unvaccinated group of the population. The relevant question is: Are unvaccinated groups having higher or lower mortality rates than vaccinated groups (Figure 19).

Figure 19: Real objective evaluation of COVID vaccines effectiveness: comparing mortality rate of vaccinated group with mortality rate of unvaccinated group.
Research that claims vaccines are saving lives is avoiding this research methodology.This shows a deep crisis of empiricism in medicine. COVID vaccines use spike protein technology that was used on humans massively for the first time in the COVID pandemic. We will discuss the efficacy of spike protein technology.
French geneticists discovered that the spike protein SARS-CoV-2 contains a motif that is homologous to that of snake neurotoxins: “The recently published cryo-EM structure of the trimeric SARS- CoV-2 Spike (S) protein revealed an insertion with respect to that of SARS-CoV-1, in a loop that is disordered in the reported structure, and which has a polybasic sequence that corresponds to a furin site. Importantly, this exposed loop of the SARS-CoV-2 S protein also contains a motif that is homologous to that of snake neurotoxins and to the RABV neurotoxin-like region” [14]. Clinical research has confirmed that spike protein can damage endothelial cells and disrupt the blood-brain barrier [15]. Recent research by Italian and US researchers has revealed how the SARS-CoV-2 Spike protein interacts with human Estrogen Receptor-α17 (ERα) leading to severe coagulopathy [16]. Snake venom causes severe coagulopathy [17].
Clinical research published in October 2021 found high levels of enzyme sPLA2-IIA in COVID patient blood. This enzyme has similarities to an active enzyme which is in rattlesnake venom [18]. The University of Arizona published about this research in 2023: “Researchers from the University of Arizona, in collaboration with Stony Brook University and Wake Forest School of Medicine, analyzed blood samples from two COVID-19 patient cohorts and found that circulation of the enzyme–secreted phospholipase A2 group IIA, or sPLA2-IIA, – may be the most important factor in predicting which patients with severe COVID-19 eventually succumb to the virus. The sPLA2-IIA enzyme, which has similarities to an active enzyme in rattlesnake venom, is found in low concentrations in healthy individuals and has long been known to play a critical role in defense against bacterial infections, destroying microbial cell membranes. When the activated enzyme circulates at high levels, it has the capacity to “shred” the membranes of vital organs, said Floyd (Ski) Chilton, senior author on the paper and director of the UArizona Precision Nutrition and Wellness Initiative in the university’s College of Agriculture and Life Sciences” [19]. The methodological mistake of this study is in the prediction that the organism produces a high level of this enzyme because of the COVID-19 virus. Why an organism would start poisoning itself after being infected with the COVID-19 virus is not explained. It is also possible that the organism produces a high level of this enzyme because of COVID vaccination. This option is automatically excluded, which again is a methodological mistake.
In scientific methodology, the possibility, that spike protein functions in organisms like snake venom cannot be excluded and has to be examined in two groups: the vaccinated group and the unvaccinated group. This should be urgently done to protect public health worldwide. On the basis of public data from England, we calculated that the vaccinated part of the population has about 14.5% higher mortality rate than the unvaccinated part of the population [6]. The cause of higher mortality of the vaccinated part of the population could be spike protein that functions as snake venom. Massive COVID vaccination was performed in the spring of 2021. Now, after two years, the presence of spike proteins in the blood of a larger group of vaccinated people should be examined and compared with the blood of a control group of unvaccinated people of the same age and sex-gender.
Spike protein SARS-CoV-2 was patented back in 2021, the classification is “A61K39/12-Viral antigens” [20]. Spike protein is man-made gene technology. The technology of spike proteins developed the procedure about how to develop prefusion-stabilized spike variants [21]. Spike proteins are considered the latest scientific achievement to protect human health, although some scientists warn of their potential danger [22]. An article published in February 2023 warns about the potential role of spike protein in neurodegenerative diseases [23]. In small doses, venom snake stimulates the process of neuritogenesis, and consequently nerve system regeneration [24]. In big doses, snake venom targets and destroys the nervous system [25].
The key question is the concentration of spike proteins in blood in a longer time period after vaccination. In patients with post vaccine myocarditis, elevated levels of spike protein were discovered: “Notable finding was that markedly elevated levels of full-length spike protein (33.9 ± 22.4 pg/mL), unbound by antibodies, were detected in the plasma of individuals with post vaccine myocarditis, whereas no free spike was detected in asymptomatic vaccinated control subjects (unpaired t test; P<0.0001)” [26]. In February 2023 an article was published about the discovery of a high concentration of spike protein in the blood of long COVID patients: “In only a few cases, the presence of S1 or spike may be correlated with vaccination; however, according to our previous findings, S1 is only detected soon after the first dose and spike is rarely detected” [27]. Authors claimed that the presence of spike proteins is mostly not related to vaccination but to infection with COVID-19, which again is wrong from the methodological point of view. The cause of the spike proteins’ presence in blood could also be vaccination. After vaccination, mRNA molecules packed in lipid nanoparticles enter the muscles, and when lipid nanoparticles enter the cells, they start producing spike proteins [28]. In unvaccinated people, this process of spike protein production activated by mRNA did not occur. So, we can predict that a high level of spike proteins will occur in the vaccinated cohort with a much higher probability than in the unvaccinated cohort.
Nobel Prize winner for medicine Dr. Montaigner has published an article with colleagues’ shows that COVID vaccines are causing Creutzfeldt-Jacob Disease: “The clinical facts reported in this article confirm an unnatural, injection related, new form of Creutzfeldt-Jacob Disease. The stereotypic post-vaccine symptoms appear almost immediately, or very soon after a jab, usually the second one, suggesting that a first injection is a potentiating event, all of which are followed by lightning-fast development of the disease progressing to its final conclusion in death. The advance warnings from Luc Montagnier widely referred to in the media—for just two examples leading to many references on the internet, in his speech before the Luxembourg Parliament on January 12, 2021 (World Freedom Alliance, 2021) and in an interview on May 18, 2021 were based on his far-sighted genetic studies of pathogenic prion regions in the proteins of different species. Those intensive genetic studies led to the hypothesis of the now demonstrated Creutzfeldt-Jacob Disease “side effects” of the COVID-19 “vaccines” [29].
German pathologist Michael Mörz has discovered spike proteins in heart and brain tissues of vaccinated persons that were not infected with COVID-19: “Although there was no history of COVID-19 for this patient, immunohistochemistry for SARS-CoV-2 antigens (spike and nucleocapsid proteins) was performed. Spike protein could be indeed demonstrated in the areas of acute inflammation in the brain (particularly within the capillary endothelium) and the small blood vessels of the heart. Remarkably, however, the nucleocapsid was uniformly absent. During an infection with the virus, both proteins should be expressed and detected together. On the other hand, the gene-based COVID-19 vaccines encode only the spike protein and therefore, the presence of spike protein only (but no nucleocapsid protein) in the heart and brain of the current case can be attributed to vaccination rather than to infection. This agrees with the patient’s history, which includes three vaccine injections, the third one just 3 weeks before his death, but no positive laboratory or clinical diagnosis of the infection” [30].
MÃÂ?¶rz conclusions confirm the danger of spike protein: “Numerous cases of encephalitis and encephalomyelitis have been reported in connection with the gene-based COVID-19 vaccines, with many being considered causally related to vaccination. However, this is the first report to demonstrate the presence of the spike protein within the encephalitic lesions and to attribute it to vaccination rather than infection. These findings corroborate a causative role of the gene-based COVID-19 vaccines, and this diagnostic approach is relevant to potentially vaccine-induced damage to other organs as well [30].
Despite irrefutable statistical and clinical evidence of bad results of COVID vaccines, there is a huge interest in COVID vaccination being seen as a successful intervention to improve public health. Also, catboats played an important role to convince people that COVID vaccination was meaningful [31]. We live in a turbulent time of confrontation between human-oriented science and capital-oriented science, which often prioritizes profit over the protection of public health. As always happened in the history of mankind, in the end, human-oriented science will prevail, because we are humans.
What is the effectiveness of COVID vaccines on the world scale?. According to Our World in Data in 2019 57,94 million people died. In 2020 63,17 million persons died on this globe, in 2021 died 69,25 million persons and in 2022 has died 67,10 million persons [32]. In 2020 the COVID-19 virus was killing people massively worldwide, so in 2020 died 5,23 million people more than in 2019. In 2021 finally, the cure came, and massive vaccination started. In 2021 6,08 million people more died than in 2020. Where are hiding the 14,4 million saved lives with corona vaccines (Table 3).
| Year | Number of people died (in millions) | Average mortality rate (in millions) |
|---|---|---|
| 2015 | 55,89 | 56,87 |
| 2016 | 56,20 | 56,87 |
| 2017 | 56,97 | 56,87 |
| 2018 | 57,35 | 56,87 |
| 2019 | 57,94 | 56,87 |
| 2020 | 63,17 | +6,30 |
| 2021 | 69,25 | +12,28 |
| 2022 | 67,10 | +10,23 |
Table 3: Effectiveness of covid vaccines on the world scale and excess mortality in 2020, 2021 and 2022.
A comparison of excess mortality rates in Australia and Papua New Guinea gives us a clear insight into the worldwide excess mortality case. According to data from John Hopkins Corona Virus Resource Center, until 10 March 2023, when they stopped collecting the data, at least one dose of vaccine was received by 4.2% of the Papua New Guinea population, whereas in Australia at least one dose was received by 87.3% of the population [33,34]. In Australia, excess mortality rate was 12% for the year 2022: “There were 20.200 more deaths in 2022 than would have been expected if the pandemic had not happened, with a total excess mortality of 12% for the year, found a review of excess deaths by Australia’s Actuaries Institute’s COVID-19 mortality working group” [35] (Figure 20).

Figure 20: On the left covid vaccine doses administered per 100 people, on the right Covid-19 deaths per million people in Australia and Papua New Guinea. Note: ( ) Australia; (
 ) Papua New Guinea
Red spots on the right and left sides are from 29 January 2022 [7]. The figure above confirms that the massive vaccination is destroying the natural immune response, which is causing higher mortality of the COVID-19 virus. In the year 2022, vaccinated people in Australia have been massively dying because their natural immunity was destroyed by vaccines and the virus COVID-19 become deadly. In the year 2022, unvaccinated people in Papua New Guinea have not massively died because of the COVID-19 virus because they have not been vaccinated, and their natural immunity protected them. This analysis confirms that COVID vaccination is the main cause of excess mortality worldwide in the year 2022.
Conclusion
The COVID-19 vaccination was done worldwide in an extreme rush to diminish the excess mortality rate because of the COVID-19 virus. The expected result was not achieved, and the statistical data are proving the opposite. The experts for public health should respect ordinary scientific procedures of the basic standard where first we check up on a new medicine on a limited group of people and when being sure that medicine is working well we consider it makes sense to use it worldwide. All research that concluded that COVID-19 vaccines were successful and diminished mortality rates have used improper methodologies and have no support in the analysis of the basic statistical data which prove the mortality rate of vaccinated cohorts is higher than the mortality rate of unvaccinated cohorts. Clinical research is confirming that spike protein technology applied in COVID vaccines causes’ severe damage to human health. Its use on humans was premature and did not protect public health. The opposite was achieved.
References
- Vella G, Genovese D, Belluzzo M, Mazzeo L, Pisciotta V, Amodio E. Effectiveness of mRNA vaccine booster against SARS-COV-2 infection and COVID-19 in the adult population during the first three months of the omicron wave in Sicily. Healthcare (Basel). 2023;11(3):305.
[Crossref] [Google Scholar] [Pubmed]
- Amodio E, Vella G, Restivo V, Casuccio A, Vitale F. On behalf of the COVID surveillance working group of the university of Palermo. Effectiveness of mRNA COVID-19 vaccination on SARS-COV-2 infection and COVID-19 in Sicily over an eight-month period. Vaccines (Basel). 2022;10(3):426.
[Crossref] [Google Scholar] [Pubmed]
- Mohammed I, Nauman A, Paul P, Ganesan S, Chen KH, Jalil SM, et al. The efficacy and effectiveness of the COVID-19 vaccines in reducing infection, severity, hospitalization, and mortality: A systematic review. Hum Vaccin Immunother. 2022;18(1):2027160.
[Crossref] [Google Scholar] [Pubmed]
- Lin DY, Gu Y, Wheeler B, Young H, Holloway S, Sunny SK, et al. Effectiveness of COVID-19 vaccines over a 9-month period in North Carolina. N Engl J Med. 2022;386(10):933-941.
[Crossref] [Google Scholar] [Pubmed]
- Arbel R, Hammerman A, Sergienko R, Friger M, Peretz A, Netzer D, et al. BNT162b2 vaccine booster and mortality due to COVID-19. N Engl J Med. 2021;385(26):2413-2420.
[Crossref] [Google Scholar] [Pubmed]
- Šorli S, Makovec T, Krevel Z, Gorjup R. Forgotten “Primum Non Nocere” and increased mortality after COVID-19 vaccination. Qual Prim Care. 2023;31(6):56-64.
- Our world data. 2020
- US mortality. 2022
- Watson OJ, Barnsley G, Toor J, Hogan AB, Winskill P, Ghani AC. Global impact of the first year of COVID-19 vaccination: a mathematical modelling study. Lancet Infect Dis. 2022;22(9):1293-1302.
[Crossref] [Google Scholar] [Pubmed]
- Kory P, Meduri GU, Varon J, Iglesias J, Marik PE. Review of the emerging evidence demonstrating the efficacy of ivermectin in the prophylaxis and treatment of COVID-19. Am J Ther. 2021;28(3):e299.
[Crossref] [Google Scholar] [Pubmed]
- Skidmore M. RETRACTED ARTICLE: The role of social circle COVID-19 illness and vaccination experiences in COVID-19 vaccination decisions: an online survey of the United States population. BMC Infect Dis. 2023;23(1):1-3.
[Crossref] [Google Scholar] [Pubmed]
- Seneff S, Kyriakopoulos AM, Nigh G, McCullough PA, Kyriakopoulos A. A potential role of the spike protein in neurodegenerative diseases: A narrative review. Cureus. 2023;15(2):e34872.
[Crossref] [Google Scholar] [Pubmed]
- Faust JS, Renton B, Chen AJ, Du C, Liang C, Li SX, et al. Uncoupling of all-cause excess mortality from COVID-19 cases in a highly vaccinated state. Lancet Infect Dis. 2022;22(10):1419-1420.
[Crossref] [Google Scholar] [Pubmed]
- Changeux JP, Amoura Z, Rey FA, Miyara M. A nicotinic hypothesis for COVID-19 with preventive and therapeutic implications. Comptes Rendus. C R Biol. 2020;343(1):33-39.
[Crossref] [Google Scholar] [Pubmed]
- Buzhdygan TP, DeOre BJ, Baldwin-Leclair A, Bullock TA, McGary HM, Khan JA, et al. The SARS-CoV-2 spike protein alters barrier function in 2D static and 3D microfluidic in-vitro models of the human blood–brain barrier. Neurobiol Dis. 2020;146:105131.
[Crossref] [Google Scholar] [Pubmed]
- Barbieri SS, Cattani F, Sandrini L, Grillo MM, Amendola A, Valente C, et al. Relevance of Spike/Estrogen Receptor-α interaction for endothelial-based coagulopathy induced by SARS-CoV-2. Signal Transduct Target Ther. 2023;8(1):203.
[Crossref] [Google Scholar] [Pubmed]
- Berling I, Isbister GK. Hematologic effects and complications of snake envenoming. Transfus Med Rev. 2015;29(2):82-89.
[Crossref] [Google Scholar] [Pubmed]
- Snider JM, You JK, Wang X, Snider AJ, Hallmark B, Zec MM, et al. Group IIA secreted phospholipase A 2 is associated with the pathobiology leading to COVID-19 mortality. J Clin Investi. 2021;131(19):e149236.
[Crossref] [Google Scholar] [Pubmed]
- The University of Arizona. Like Venom Coursing Through the Body: Researchers Identify Mechanism Driving COVID-19 Mortality. 2021
- Dong Yu, Giulietta Maruggi, Jason W Westerbeck, Jeffrey B, Ulmerjason P, Laliberte, et al. SARS COV-2 spike protein construct. 2021
- Schaub JM, Chou CW, Kuo HC, Javanmardi K, Hsieh CL, Goldsmith J, et al. Expression and characterization of SARS-CoV-2 spike proteins. Nat Protoc. 2021;16(11):5339-5356.
[Crossref] [Google Scholar] [Pubmed]
- Theoharides TC, Conti P. Be aware of SARS-CoV-2 spike protein: There is more than meets the eye. J Biol Regul Homeost Agents. 2021;35(3):833-838.
[Crossref] [Google Scholar] [Pubmed]
- Seneff S, Kyriakopoulos AM, Nigh G, McCullough PA, Kyriakopoulos A. A potential role of the spike protein in neurodegenerative diseases: a narrative review. Cureus. 2023;15(2):e34872.
[Crossref] [Google Scholar] [Pubmed]
- Hernández‐Kelly LC, Ortega A. A unique snake venom neuritogenesis mechanism: A cornerstone in the treatment of neurodegenerative diseases? An Editorial Highlight for “Transcriptomic, proteomic, and biochemical analyses reveal a novel neuritogenesis mechanism of Naja naja venom α‐elapitoxin post binding to TrkA receptor of rat pheochromocytoma cells” on 612. J Neurochem. 2020;155(6):599-601.
[Crossref] [Google Scholar] [Pubmed]
- Osipov AV, Utkin YN. Snake venom toxins targeted at the nervous system. Springer. 2017:189-214.
- Yonker LM, Swank Z, Bartsch YC, Burns MD, Kane A, Boribong BP, et al. Circulating Spike Protein Detected in Post–COVID-19 mRNA Vaccine Myocarditis. Circulation. 2023;147(11):867-876.
[Crossref] [Google Scholar] [Pubmed]
- Swank Z, Senussi Y, Manickas-Hill Z, Yu XG, Li JZ, Alter G, et al. Persistent circulating severe acute respiratory syndrome coronavirus 2 spikes is associated with post-acute coronavirus disease 2019 sequelae. Clin Infect Dis. 2023;76(3):e487-490.
[Crossref] [Google Scholar] [Pubmed]
- Hou X, Zaks T, Langer R, Dong Y. Lipid nanoparticles for mRNA delivery. Nat Rev Mater. 202;6(12):1078-1094.
[Crossref] [Google Scholar] [Pubmed]
- Perez JC, Moret-Chalmin C, Montagnier L. Emergence of a new creutzfeldt-jakob disease: 26 cases of the human version of mad-cow disease, days after a COVID-19 injection. Int J Vaccine Theory Pract Res. 2023;3(1):727-770.
- Mörz M. A case report: multifocal necrotizing encephalitis and myocarditis after BNT162b2 mRNA vaccination against COVID-19. Vaccines. 2022;10(10):1651.
[Crossref] [Google Scholar] [Pubmed]
- Lee KY, Dabak SV, Kong VH, Park M, Kwok SL, Silzle M, et al. Effectiveness of Chabot’s on COVID vaccine confidence and acceptance in Thailand, Hong Kong, and Singapore. NPJ Digit Med. 2023;6(1):96.
[Crossref] [Google Scholar] [Pubmed]
- Our world in data. 2023
- Kuhbandner C, Reitzner M. Estimation of excess mortality in Germany during 2020-2022. Cureus. 2023;15(5):e39371.
- John Hopkins University of Medicine, Coronavirus Resource Center. 2023
- Barrett A. COVID-19 was the third leading cause of death in Australia last year. BMJ. 2023;381:842.
[Crossref] [Google Scholar] [Pubmed]
Citation: Makovec T, Å orli AS, Gorjup R, Krevel Z, Piberl S (2023) Analysis of COVID-19 Vaccination Effectiveness. J Vaccines Vaccin. 14:530.
Copyright: © 2023 Makovec T, et al. This is an open-access article distributed under the terms of the Creative Commons Attribution License, which permits unrestricted use, distribution, and reproduction in any medium, provided the original author and source are credited.