

Indexed In
- Open J Gate
- Genamics JournalSeek
- Academic Keys
- ResearchBible
- Cosmos IF
- Access to Global Online Research in Agriculture (AGORA)
- Electronic Journals Library
- RefSeek
- Directory of Research Journal Indexing (DRJI)
- Hamdard University
- EBSCO A-Z
- OCLC- WorldCat
- Scholarsteer
- SWB online catalog
- Virtual Library of Biology (vifabio)
- Publons
- Geneva Foundation for Medical Education and Research
- Euro Pub
- Google Scholar
Useful Links
Share This Page
Journal Flyer
Open Access Journals
- Agri and Aquaculture
- Biochemistry
- Bioinformatics & Systems Biology
- Business & Management
- Chemistry
- Clinical Sciences
- Engineering
- Food & Nutrition
- General Science
- Genetics & Molecular Biology
- Immunology & Microbiology
- Medical Sciences
- Neuroscience & Psychology
- Nursing & Health Care
- Pharmaceutical Sciences
Research Article - (2025) Volume 13, Issue 5
Adoption of Agricultural Technology Packages in Barley Based Farming System of Ethiopia
Ermias Getnet*Received: 10-Jul-2023, Manuscript No. AGT-23-22086; Editor assigned: 13-Jul-2023, Pre QC No. AGT-23-22086 (PQ); Reviewed: 28-Jul-2023, QC No. AGT-23-22086; Revised: 14-Jan-2025, Manuscript No. AGT-23-22086 (R); Published: 21-Jan-2025, DOI: 10.35248/2168-9881.25.14.395
Abstract
Background: Improving the wellbeing of smallholder farmers through the promotion of improved technologies has gained increased attention in recent times. Despite the high production potential and the economic importance of the crop, adoption, and diffusion of barley technologies are constrained by various factors. The purpose of the study is aimed at identifying determinants of adoption of agricultural technologies in the barley-based farming system of Ethiopia, with the specific objectives of identifying factors affecting agricultural technology package choice and assessing the interdependency between the technologies.
Method: The study used data from the Ethiopian socioeconomic survey. The descriptive and econometric analytical tools were applied. The research employed the multivariate probit model to estimate the factors that influenced the adoption of agricultural technologies choice for barley production.
Result: The descriptive result of the study identified that variables like education, family size, credit access, farm size, farm income, and age of the farmer play significant roles, across barley technologies. The results show that about 66.96%, 58.59%, 75.18%, 65.17%, and 75.99% of sample households were adopted an improved variety of barley, urea, DAP, chemicals, manure, and crop rotation respectively. Multivariate probit model results showed that age of household head, soil fertility, farm size, training, and transportation cost affect the adoption of barley technologies negatively and significantly. Sex of household head, education level of household head, farm income, tropical livestock unit, and access to credit affect the adoption of barley technologies positively and significantly.
Conclusion: Smallholder farmers were more likely to succeed than fail in jointly adopting barley technologies. Consequently, government policy and other concerned parties should emphasize on the improvement of the institutional support system and decrease gender disparities in access to such institutions.
Keywords
Adoption; Barley; Agricultural technologies; Multivariate probit
Abbreviations
AGSS: Annual Agricultural Sample Survey; CGIAR: Consultative Group for International Agricultural Research; CSA: Central Statistical Agency; EAs: Enumeration Areas; ESS: Ethiopian Socio-Economic Survey; GDP: Gross Domestic Product; ISA: Integrated Survey on Agriculture; LSMS: Living Standard Measurement Study; MoARD: Ministry of Agriculture and Rural Development; MVP: Multivariate Probit; SPIA: Standing Panel on Impact Assessment
Introduction
Agriculture is the base for the whole socio-economic structure and has the main effect on all other economic sectors of Ethiopia. The sound performance of agriculture permits the availability of food crops. This achievement in agriculture does not only signify the adequate acquirement of food crops to attain food security but also heralds a positive aspect of the economy.
Regarding this, collective efforts are being geared to securing agricultural outputs of the desired level so that self-reliance in food supply can be achieved and disaster-caused food shortages are contained in the shortest possible time in Ethiopia.
Agriculture is a leading sector of the Ethiopian economy which had a higher contribution to the gross domestic product, foreign exchange earnings, and employment. Agriculture is quite supposed to remain a sector that plays a key role in encouraging the overall economic development of the country. This would be comprehended if and only if obstinate efforts are made by the government and other concerned bodies including farmers to boost agricultural production and productivity [1].
Ethiopian agriculture is dominated by subsistence, low output; low input, and rain-fed farming systems. The use of chemical fertilizer and improved seeds is relatively limited despite the government efforts to encourage the adoption of modern, intensive agricultural practices. Low agricultural productivity can be attributed to limited access by smallholder farmers to agricultural inputs, financial services, improved production technologies, irrigation and agricultural markets, and more importantly poor land management practices that have led to severe land degradation.
Barley is one of the essential food and survival crop in the country; it is an annual crop that is produced in more than 800,000 h. Barley is categorized into malt barley and food barley. Malt barley is a vital cash crop for resource-poor households in Ethiopia. Ethiopia commonly produces food barley, with its share estimated to be 90% while that of malt barley has a share of 10%.
However, a long history of cultivation and livelihood importance of barley, its productivity has never increased above 2.2 t ha-1, which is about one-third of the potential yield of 6.0 t ha-1 obtained in experimental plots. The declines in soil fertility driven by high rates of soil erosion, suboptimal fertilizer application rate, nutrient imbalance, and limited access to improved varieties are among the major limiting factors claimed for low food barley productivity in Ethiopia [2].
Adoption of agricultural technologies in developing countries appeals to substantial consideration since it can offer the basis for rising production and income. The farmers’ decision can adopt or reject agricultural technologies based on their purposes and limitations as well as costs and benefits adding to it. Consequently, farmers will adopt only technologies that suit their needs. Numerous factors affect the adoption of agricultural technologies. Among these, social factors, economic factors, institutional factors, are the main variables that affect adoption. Accordingly, recent studies have been made on the determinants of adoption of barley and other crops both in Ethiopia and other countries.
Furthermore, previous studies have focused mainly on factors affecting the adoption of improved variety alone. Barley technology package consisting of improved seed, urea, DAP, fertilizer rate, and crop rotation was introduced to the study area to improve the food security status. Despite such intervention adoption of an improved barley production package is still very low. Besides, there is also variation among farmers in their intensity of adoption of an improved barley production package. However, there is no empirical information about the extent of adoption, various factors influencing adoption, and intensity of use of the package. Therefore, this study was proposed to analyze determinants of adoption and intensity of use of barley production technology package to fill the existing knowledge gap. It assisted in providing policy recommendations on technologies supply based on farmers' input expenditure patterns. It is also possible to drive a demand system for agricultural technologies.
Objectives of the study
• To identify factors affecting agricultural technology package choices.
• To assess the inter-dependence of barley production technologies.
Materials and Methods
In this section, a brief description of the study area, research approach, research design, sampling methods, sources and types of data, methods of data analysis, are presented.
Description of the study area
The study was carried out in Ethiopia. Ethiopia is the secondmost populous country in Africa with an estimated population of more than 100 million. Ethiopia is located in the horn of the continent covering the land with an area of 112.3 million hectares. Agriculture is the mainstay of its economy, accounting for 46.3 percent of Gross Domestic Product (GDP). Out of the total land area, 16.4 million hectares are allotted for the production of perennial and annual crops. According to Dorosh and Gemessa, barley, wheat, teff, maize, and sorghum production constitutes the major food crops in the country, accounting for three-fourths of the total area of land under cultivation and 14 percent of GDP. Coffee, pulses, hides, skins, oilseeds, tea, honey, and beeswax are the major agricultural exports of the country.
Data sources, type, and methods of collection
The study was used Ethiopian Socioeconomic Survey (ESS) data conducted by the CGIAR Standing Panel on Impact Assessment (SPIA) in collaboration with the LSMS-ISA project and the central statistical agency of Ethiopia in 2015/2016 by extracting barley producers. The comprehensive survey was undertaken in four major regions of the country; (Amhara, Oromiya, SNNP, and Tigray) and Addis Ababa; quotas were set for the number of EAs in each region. The sample is not representative of each of the small regions including Somalie, Benshangul Gumuz, Afar, Harari, Gambella, Dire Dawa, and regions of the country. Moreover, regular statistical reports from sources like the Ministry of Agriculture and CSA have been reviewed [3].
Research design
The research design of the study was a cross-sectional research design. The survey conducted by ESS was designed to be implemented in two visits following the AgSS field schedule [4]. The qualitative and quantitative data were conducted from sample respondents in all selected areas. In this visit, the postplanting agriculture and livestock questionnaires were administered.
Sampling design
The sample was designed in a two-stage probability sample. The first stage of sampling entailed selecting primary sampling units, or CSA Enumeration Areas (EAs). A total of 433 EAs were selected based on probability proportional to the size of the total EAs in each region. For the rural sample, 290 EAs were selected from the AgSS EAs. A total of 43 and 100 EAs were selected for small towns and urban areas, respectively [5]. However, the study was used 693 households by extracting barley producers.
Method of data analysis
In this study, both descriptive statistics and an econometric model were used to analyze the data.
Descriptive statistics: Descriptive statistics such as mean, frequencies, percentages, and standard deviation were used to have a clear depiction of the characteristics of sample units. A correlation matrix is also used to check technological complementarities or substitutability’s in terms of dependent variables [6].
Econometric model: Different econometric models were applied in the literature to measure determinants of agricultural technology adoption with advantages and shortcomings. Linear probability is easiest for binary but difficult disturbance terms. Univariate model has a problem to measure the potential correlation among the unobserved disturbance and relationship between different choices.
Multinomial logit model needs the choice variables to be mutually exclusive and assumes independence across outcomes. Multinomial probit models require multivariate normal integration to predict unknown parameters [7]. MVP is the binary response regression model used to estimate both observed and unobserved influence on dependent variables by several independent variables simultaneously.
Multivariate Probit (MVP) regression was used to estimate the factors that influenced the adoption of agricultural technologies choice for barley production. Statisticians and econometricians view the multivariate probit model used to estimate different correlated binary outcomes simultaneously. Generally, a multivariate model extends to more than two outcome variables just by adding equations. Adoption of specific technologies depends on other technological choices on a similar farm [8]. The MVP simultaneously models the relationship between a set of covariates and each of the different technologies, while allowing unobserved and unmeasured factors to be correlated. Correlation among the different adoption decisions may be due to technological complementarities or substitutability. When such correlation occurs, estimates of simple probit models would be inefficient and biased. In this study, six different agricultural technologies were identified for barley production (improved seeds, chemical fertilizers, urea, DAP, manure, Crop Rotation (CR)). Therefore the study has six dependent binary variables yij for household i and plot j [9].
y*ijm=Xijm βm+εijm m=1, 2 ...6 (1)
yijm=1 if y*ijm > 0 (2)
0 if otherwise
Where y*ijm is a latent variable that captures the degree to which a farmer views technology m as beneficial. This latent variable is assumed to be a linear combination of observed plot and household characteristics, X ijm, and unobserved characteristics captured by the stochastic error term, εijm. The vector of parameters to be estimated is denoted by βm. Given the latent nature of y*ijm, estimation is based on observable binary variables yijm, which indicate whether or not a farmer used a particular technology in the reference year. A few previous technology adoption studies also used a multivariate probit model, such as Samuel and Shaibu, who analyzed the adoption of improved agricultural technologies among rice farmers in Ghana: A multivariate probit approach. The error terms εijm (m=1, 2...6) is distributed multivariate normal each with mean 0 and a variance-covariance matrix V, where V has 1 on the leading diagonal, and correlations pjk=pkj as off-diagonal elements [10].
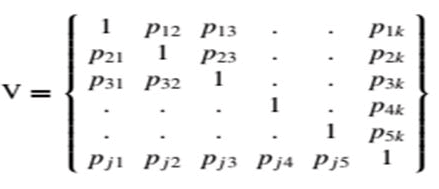
Ρ is the pairwise correlation coefficient of the error terms with regards to any two of the estimated adoption equations in the model. The correlation between the stochastic components of different improved technologies adopted is represented by the off-diagonal elements (e.g. ρjk, pkj) in the variance-covariance matrix. The correlation is based on the principle that adoption of a particular improved practice may depend on another (complementarity or positive correlation) or may be influenced by an available set of substitutes (negative correlation).
Before running the econometric model, the data were tested against econometric problems. Accordingly, the data were checked for multicollinearity test for all variables was done using Variance Inflation Factor (VIF). However, the value of VIF was low and below 10), which indicates the absence of severe multicollinearity problem among the explanatory variables.
Moreover, the Breusch-Pagan test was also used to detect the presence of heteroskedasticity. The test result indicated that there was no problem of heteroscedasticity in the model.
Variables description and measurement
Dependent variables: The dependent variables consist of dummy variables indicating the adoption of particular technologies, (from 1 to 6), such as improved seeds, chemical fertilizers, urea, DAP, manure, crop rotation. The multivariate probit model takes binary variables yijm, which indicate whether or not a farmer used a particular technology (Tables 1 and 2).
| Technology adoption dummies | Description and measurement |
|---|---|
| Improved seeds | Dummy=1 if used improved seed, 0 otherwise |
| Chemical fertilizer | Dummy=1 if farmer used chemical fertilizers, 0 otherwise |
| Urea | Dummy=1 if farmer used Urea on the plot, 0 otherwise |
| DAP | Dummy=1 if a farmer used DAP on the plot, 0 otherwise |
| Manure | Dummy=1 if farmer used manure on the plot, 0 otherwise |
| Crop Rotation (CR) | Dummy=1 if practiced crop rotation on your land holding, 0 otherwise |
Table 1: Dependent variables and their hypothesized.
Variables description and measurements
| Variables | Type | Measurement of variables | Expected effect |
|---|---|---|---|
| Demographic factors | |||
| Sex of household head | Dummy | Male-1, otherwise 0 | +/- |
| Family size | Continuous | Number | + |
| Age of HH head | Continuous | Number | +/- |
| Socioeconomic factors | |||
| Education level of HH head | Continuous | Number of years studied | + |
| Livestock owned | Continuous | Number | + |
| Farm income | Continuous | Number | + |
| Farm characteristics | |||
| Farm size | Continuous | Hectare | + |
| Soil fertility | Dummy | 1 if good, 0 poor | + |
| Oxen power | Continuous | Number | + |
| Land fragmentation | Continuous | Number | - |
| Erosion | Dummy | 1 if the field is prevented from erosion 0, otherwise | - |
| Institutional factors | - | ||
| Transportation cost | Dummy | Birr | - |
| Access to credit | Dummy | If the household uses credit=1, otherwise, 0 | + |
| Training | Dummy | If got training 1, otherwise 0 | + |
| Contact with extension agents | Dummy | 1-yes no-0 | + |
| Crop insurance | Dummy | 1-if bought crop insurance, 0 otherwise | + |
| Access to irrigation | Dummy | 1-if accessed, 0 otherwise | + |
Table 2: Independent variables and their hypothesized effects on household technology adoption.
Results and Discussion
Descriptive statistics results
Demographic characteristics of households: The study required to find out the gender and age distribution among the respondents in Ethiopia. The respondents were asked to indicate their gender and age this was done to assess if demographic characteristics of the respondents had any influence in the adoption of agricultural technology in barley production [11].
The result presented in Table 3 indicated that 83.98% of the respondents were male-headed, and the rest 16.02% were female-headed. This implies that male-household heads have access of adopting barley technology packages than females who are in most cases restricted to home chores. Therefore, gender equity among the respondents who participated in this study was not achieved. This could also point out the low participation of women in agricultural activities in Ethiopia.
The results show in Table 4 indicated that the mean age of household heads was 43 years. This meant that majority of the respondents were mature middle-aged people, which implies most of the barley producers had more experience in adoption of barley production packages [12].
| Sex of household head | Freq. | Percent |
|---|---|---|
| Male | 582 | 83.98 |
| Female | 11 | 16.02 |
Table 3: Sex characteristics of respondents.
| Variable | Mean | Std. dev. | Min | Max |
|---|---|---|---|---|
| Age | 43.47042 | 11.72411 | 21 | 80 |
Table 4: Age of sample households.
Socio-economic characteristics: Table 5 provides a summary of socio-economic characteristics status of the households in this study. Household size is a key variable that characterizes farm households. The mean family size and land size of households were 6.94 in man day equivalent and 4.3 ha, respectively. This indicates, the average landholding for barley production was high in the area. Education can affect the productivity of barley farmers and the adoption of agricultural technology packages. Therefore, literate barley producers are estimated to be in a better knowledge and use information which used to develop their adoption of agricultural technologies. According to the survey results, the overall average year of formal schooling of the total sampled household heads had up to only 5 years of formal education [13]. This indicates a low level of formal education among barley farmers in Ethiopia; the findings are shown in Table 5.
On average, a farmer had up to 1.34 oxen in a number, indicates a farmer had a small number of oxen to enrich agricultural activities in the area, consequently, farmers enforced to rent oxen as require as the size of a farm. Additionally, farmers have 13 numbers of plots, which indicates there is a higher land fragmentation in Ethiopia, having of larger fragmented land it might be difficult to manage a farm properly and unable to produce quality standard barley grain.
Farm animals are a source of draught power, food, animal dung for organic fertilizer, cash, and used as means of transportation. To help with the analysis, the livestock number was converted to a Tropical Livestock Unit (TLU). The average number of livestock owned by sampled households which were measured by Tropical Livestock Unit (TLU) is 5.4 tropical livestock units. The number of livestock owned accounted for all types of livestock possessed by the household. This indicates the farmers had high livestock units which are important for the source of income of agricultural activities in the area. Hence, a household with large livestock holding can have good access to more draught and it is one of the main cash sources to purchase inputs.
Farm income is believed to be the main source of capital for purchasing agricultural technology packages. Thus, those farmers with a relatively higher degree of farm income are more likely to purchase agricultural technologies for barley production. Therefore, a mean of annual income for sample households was 1572.07 birr from crop and livestock sales. This indicates farmers had a lower level of farm income to purchase improved seeds, fertilizers, chemicals, or other agricultural inputs in Ethiopia, the findings are shown in Table 5.
| Variables | Mean | Std. dev. |
|---|---|---|
| Family size | 6.943723 | 3.9795 |
| Education level | 5.005772 | 2.692845 |
| Farm size | 4.379509 | 2.532788 |
| Oxen power | 1.379161 | 1.460921 |
| Land fragmentation | 13.61216 | 7.470333 |
| TLU | 4.440147 | 3.843299 |
| Total farm income | 1572.07 | 3220.39 |
| Transportation cost | 39.41477 | 100.6367 |
Table 5: Socio-economic characteristics of sample households.
Adoption of agricultural technologies by barley farmer
Table 6 presents different agricultural technologies and levels of adoption practice among barley farmers in Ethiopia. The results reveal that about 58.59% of the respondents practiced urea on barley farm plots. Accordingly, about 75.18% of the samples respondents adopt DAP. Only 19.62% of the farmers practiced chemicals on barley production. Moreover, the Table 6 shows that the respondents adopt manure, improved variety, and crop rotation with the adoption rate of 65.37%, 66.96%, and 75.99% respectively, the findings are shown in Table 6.
| Technologies | Freq. (No. farmers practicing) | % |
|---|---|---|
| Urea | 406 | 58.59 |
| DAP | 521 | 75.18 |
| Chemicals | 136 | 19.62 |
| Manure | 453 | 65.37 |
| Improved variety | 464 | 66.96 |
| Crop rotation | 497 | 75.99 |
| N=693 |
Table 6: Agricultural technologies.
Adoption and intensity of adoption of barley production package
Seeding rate: The practice of appropriate seeding rate is one of the most important uses in agricultural production. Excessive or underutilization of seed will result in poor production performance. Generally, research recommends a specified level of seeding rate for a given variety or crop with a given range of seed feasibility. The extension also advises farmers based on this research recommendation. The recommended seeding rate of barley variety is 100-125 kg per ha vary from region to region. Farmers' adoption of the recommended seeding rate however based on among numerous things on the relevance of the recommended rate itself, availability of quality seeds, uncertainty in its germination percentage, and other household-related socio-economic problems (knowledge/awareness level). The result of the average seeding rate across adoption categories as indicated in Table 7.
| Variable | Mean | Std. dev. |
|---|---|---|
| Seed quantity | 93.31009 | 92.47105 |
Table 7: Improve variety rate of application.
Farmers in Ethiopia were found to use varying seeding rates of improved barley variety. Concerning variability in the amount of seed-applied per hectare of land among sample respondents. On average, farmers applied 93.31 kg of seed per hectare of land, which is close to barley production recommendation rate; the results are shown in Table 8
Fertilizer application package: Barley production, like any other crop, requires the use of different inputs. Urea and DAP are the most important fertilizers used for various crops, to boost the production and productivity of crops. Fertilizer application is one of the most important practices that need to be adopted by barley growers [14]. Moreover, proper application of the recommended rate of urea (50-100 kg/ha) depending on N stress level is important to obtain the required yield, while the proper application rate of dap is 100 kg/ha. As far as urea and DAP fertilizers use is concerned, farmers in the area use varying fertilizer rate, which is below the recommendation. The average fertilizer application rate is shown in Table 8.
| Variable | Mean | Std. dev. |
|---|---|---|
| Urea quantity | 49.7875 | 68.99082 |
| DAP quantity | 51.48904 | 69.43529 |
Table 8: Fertilizer rate application.
The average rates of urea application for barley production by sample respondents during the production year was 49.78 kg/ herewith the standard deviation of 68.99. The mean of DAP applied rates of barley production by sample respondents was 67.07 kg/ha. The farmers had used a low level of fertilizer rather as recommended as per hectare shown in Table 8.
Sample respondents have mentioned different reasons for their use of such low fertilizer rates. In the first place, they were claiming lack of financial capacity and unavailability of fertilizer at the right time was mentioned in the second place. In their view, the amount of fertilizer to be applied per hectare of land depends on attention paid to land preparation and the fertility status of the land. Lack of soil moisture and lack of irrigation facilities may also result in low fertilizer use. It is a consequence for research indicating the need to restudy the previous research recommendation by conducting additional site-specific fertilizer trials.
The relationship between the agricultural technologies-correlations matrix residuals
Table 9 presents the results of the correlation matrix from the multivariate regression. The results indicate that all pairwise coefficients were positively correlated, positive correlation indicating complementarity among the barley production technologies. The relationships among all the technologies were significant except for chemical and urea, manure and chemical, improved variety, and chemicals.
There are several positive correlations in Table 9, indicating technological complementarities. The adoption of DAP is positively correlated with the adoption of urea. The adoption of chemicals is positively correlated with the adoption of DAP at a 5% significance level. The adoption of manure is positively correlated with the adoption of urea; DAP, at a 1% level of significance. The adoption of improved variety is positively correlated with the adoption of urea, DAP, and manure, at a 1% level of significance. The adoption of crop rotation is positively correlated with the adoption of urea, DAP, manure, and improved variety, at a 1% significance level. The adoption of crop rotation is positively correlated with the adoption of chemicals, at a 5% significance level. The highest correlation was between the adoption of improved variety and manure (95.70%); the Findings are shown in Table 9.
| Urea | DAP | Chemical F | Manure | Improved V | Crop rotation | |
|---|---|---|---|---|---|---|
| Urea | 1.0000 | |||||
| DAP | 0.5581* | 1.0000 | ||||
| Chemical F | 0.0300 | 0.1656** | 1.0000 | |||
| Manure | 0.8611* | 0.6418* | 0.1401 | 1.0000 | ||
| Improved V | 0.8206* | 0.6192* | 0.1267 | 0.9570* | 1.0000 | |
| Crop rotation | 0.6881* | 0.8331* | 0.1523** | 0.8132* | 0.7958* | 1.000 |
Table 9: Correlation matrix of the technologies from the multivariate probit model.
Results of the econometric model
This section presents the econometric results of the study. In this sub-chapter, the results of the multivariate probit model were presented and discussed. Several factors can affect barley farmers' decision to adopt one particular technology or the other. Numerous variables are significant across several places and overtime in amplifying the adoption of technologies by farmers. Many factors are expected to affect the adoption of agricultural technologies based on theoretical models and empirical evidence. Moreover, this section identifies the variables which determine the adoption of agricultural technologies by barley farmers using a multivariate probit model, the findings are shown in Table 10.
Sex of household head: As the results indicate the sex of the household head had a positive and significant influence on the adoption of urea at a 1% level of significance, the findings are shown in Table 10. This revealed that being male-headed households have better access to information on barley production technologies and are more likely to adopt urea than female-headed households. Galmesa probit regression model results revealed that the adoption of improved soya bean production technologies is biased by gender, where male-headed households are more likely to adopt soya bean varieties than their counterpart [15].
Age of household head: Age was negatively related to the adoption of improved variety and adoption of urea at a 5% level of significance, the findings are shown in Table 10. The result of the multivariate probit model indicates that younger households are more likely to give a higher amount of land to improved varieties and more likely to use urea than old-age households. The impact of this result is that younger farmers had a higher probability of adopting new technologies than older barley farmers. Moreover, Samuel et al. found a negative effect of age on the adoption of harrowing, irrigation, and bunding; the findings are shown in Table 10.
Education: Education was found to have a positive and significant relationship with the adoption of urea, manure, and improved varieties at 5%, 1%, and 1% level of significance respectively, the results are shown in Table 10. In other words, the result means that higher educational status increases farmers' awareness about the benefits of adopting urea, manure, and improved varieties. A better-educated farmer has more lucrative income sources and thus fewer capital constraints to invest in external inputs. While education had a negative and significant relationship with the adoption of chemicals at a 5% significance level but failed to explain the adoption decision of, DAP and crop rotation. Samuel et al. using the multivariate probit model to study the adoption of improved agricultural technologies among rice farmers in Ghana concluded that education increases farmers' awareness of improved technologies.
Family size: Family size was hypothesized to have a positive effect on the adoption of improved variety and manure technologies since the family is the major source of labor for agricultural activities. However, contrary to the prior expectation, it has turned out to influence the adoption of improved variety and manure negatively and significantly at a 5% level of significance, the results are shown in Table 10. Hence, given the higher opportunity cost of labor in Ethiopia, the application of more labor for other jobs will affect the adoption of agricultural technologies for barley production negatively. This finding contradicts the work of Samuel et al. who found that household size was significant and correlated positively with the adoption of bunding.
Soil fertility: The result revealed that soil fertility was negatively and significantly related to the adoption of urea, improved barley variety, and manure at 1%, 5%, and 1% level of significance respectively, the findings are shown in Table 10. The result of the multivariate probit model revealed that the farmers whose farmland was infertile more likely to adopt urea, manure and improved variety than those have fertile soil. Hence, the application of animal manure is used for the restoration of soil fertility and the improvement of crop production. Generally, the application of improved variety, urea, and manure increases the supply of nutrients to the crop and increases the organic matter content of the soil.
Farm size: Farm size was significant and had a negative relationship with the adoption of improved barley variety and manure at a 5% level of significance; the findings are shown in Table 10. Meaning, farmers with bigger farm sizes had a lower probability to adopt improved barley variety and manure compared with those who had smaller farm sizes. The negative correlation between farm size and the probability of adopting improved barley variety and manure is due to the labordemanding and capital-demanding nature of package approaches and resulting difficulty for poor farmers regardless of their farm sizes. This could be so because adopting these technologies would come with extra costs aside cost of seed and labor for manure application.
Extension contact: Household extension contact was only significant and negatively related to the decision to adopt, chemical at 5% level of significance, redundant in explaining the adoption of the other technologies, the findings are shown in Table 10. This finding did not meet the a priori expectation since the agricultural extension is meant to influence technology uptake by farmers. However, Samuel et al. posit that the household extension method does not promote cross-learning and experience sharing among farmers from different homes and backgrounds since it is carried out only within the household of the person transmitting the information.
Access to credit: As the multivariate probit model result indicates it had a positive and significant influence on the adoption of urea, DAP, manure, improved variety, and crop rotation at a 1% significance level, the results are shown in Table 10. The results of multivariate probit indicate that those households who have access to credit are more likely to adopt barley technologies than those who have no access to formal credit. Hence, accessibility of credit from appropriate sources helps farmers to purchase essential agricultural inputs. Rahmeto using the Tobit model to study determinants of adoption of improved haricot bean production package concluded that farmers who have access to credit, are more likely to adopt improved haricot bean technology.
Training: Training was significant and negatively related to the adoption of urea, DAP, improved variety, manure, and crop rotation at a 1% level of significance, the results are shown in Table 10. This implies there is a promotion of inappropriate technology, insufficient adaptive research in the barley-based training section, which might be due to the range of (class, gender, literacy, and location). The weakness in the state-led agricultural training systems has also led to the assumption of responsibility of investigating and disseminating information to farmers in Ethiopia. Contrary to a priori expectation, however, access to training access had a significant but negative relationship with the adoption of barley technologies, contradicting the findings of Samuel et al. indicates that farmers' access to agricultural training significantly and positively influenced their adoption of nursery, spacing, line planting, urea briquette, irrigation and bunding.
Tropical livestock unit: Number of livestock owned as measured by tropical livestock unit. TLU has a significant and positive influence on the adoption of DAP, manure, and improved variety at a 5% level of significance, the findings are shown in Table 10. A larger number of livestock units on the farm are associated with a higher probability of manure use and with a lower probability of retaining crop residues in the field. The result revealed that high livestock leads to exhaustive farming practices as these smooth financial constraints to purchase the agricultural technology packages and hire extra labor for the duration of peak agricultural seasons.
Farm income: Farm income was positive and significantly related to the adoption of DAP and urea at a 5% level of significance. Farm income was also positively and significantly related to the adoption of manure, improved variety, and crop rotation at a 1% level of significance, the findings are shown in Table 10. The multivariate probit model result indicated that those barley farmers with a relatively higher degree of farm income are more probable to purchase urea, DAP, and other agricultural inputs.
Transportation cost: Transportation cost was negatively and significantly related to the adoption of urea at a 1% significance level. Additionally, it was negatively and significantly related to the adoption of DAP, improved variety, manure, crop rotation at a 5% level of significance, the results are shown in Table 10. The multivariate probit model indicates that those farmers who have fewer transportation costs are more likely to adopt barley technologies than those who have high transportation costs. The possible explanation for this is that farmers who have higher transport costs might face far away from market centers and lack of information on the availability of the newly released technology provided by the extension system.
| Variables | Urea | DAP | Chemicals | Improved variety | Manure | Crop rotation | ||||||
|---|---|---|---|---|---|---|---|---|---|---|---|---|
| Coef. | Std error | Coef. | Std error | Coef. | Std error | Coef. | Std error | Coef. | Std error | Coef. | Std error | |
| Age | -.004** | 0.002 | -0.001 | 0.002 | 0.001 | 0.001 | -.004** | 0.002 | -0.003 | 0.002 | -0.004 | 0.002 |
| sex | .341* | 0.115 | .206*** | 0.11 | .156*** | 0.091 | .261** | 0.112 | .245** | 0.113 | .232** | 0.106 |
| HH edu | .030** | 0.012 | 0.003 | 0.011 | -.024** | 0.009 | .039* | 0.012 | .037* | 0.012 | 0.004 | 0.011 |
| Family size | -.012*** | 0.006 | -0.009 | 0.006 | 0.006 | 0.005 | -.014** | 0.006 | -.013** | 0.006 | -0.009 | 0.006 |
| Farm size | -0.021 | 0.012 | 0.007 | 0.012 | 0.012 | 0.01 | -.025** | 0.012 | -.025** | 0.013 | 0.001 | 0.012 |
| Soil quality | -.139* | 0.041 | -0.004 | 0.039 | 0.012 | 0.032 | -.101** | 0.039 | -.105* | 0.04 | -0.029 | 0.038 |
| Irrigation | -0.097 | 0.119 | -0.125 | 0.113 | .173*** | 0.093 | -0.056 | 0.114 | -0.002 | 0.123 | -0.105 | 0.11 |
| Ext contact | .207*** | 0.116 | 0.171 | 0.11 | -.258* | 0.091 | 0.09 | 0.112 | 0.066 | 0.114 | .205*** | 0.107 |
| Credit | .488* | 0.164 | .509* | 0.157 | 0.122 | 0.129 | .536* | 0.158 | .523* | 0.162 | .519* | 0.152 |
| Training | -.599* | 0.183 | -.539* | 0.174 | -0.115 | 0.144 | -.547* | 0.176 | -.552* | 0.181 | -.610* | 0.169 |
| Oxen power | -0.022 | 0.021 | -.035*** | 0.02 | 0.023 | 0.016 | -0.026 | 0.02 | -0.026 | 0.02 | -0.018 | 0.019 |
| Land frag | 0.003 | 0.004 | 0.0062 | 0.003 | .005*** | 0.003 | 0.002 | 0.003 | 0.003 | 0.003 | 0.004 | 0.003 |
| Crop insurance | 0.093 | 0.09 | 0.088 | 0.086 | 0.071 | 0.009 | 0.053 | 0.087 | 0.031 | 0.089 | 0.059 | 0.084 |
| Erosion | 0.083 | 0.053 | 0.06 | 0.051 | .042* | 0.083 | 0.082 | 0.051 | 0.095 | 0.053 | 0.041 | 0.049 |
| TLU | 0.011 | 0.008 | .016** | 0.007 | 0.006 | -0.002 | .017** | 0.007 | .016** | 0.008 | 0.008 | 0.007 |
| Income | .001** | 0 | .000** | 0 | 7.8-06 | 7.8-06 | .000* | 0.006 | 0.001 | 0.016 | .003* | 0 |
| T cost | -.000* | 0 | -.006** | 0 | 0.002 | 0.006 | -.000** | 0.005 | -.004** | 0.0002 | -.000** | 0 |
| _cons | 1.075 | 0.276 | 0.747 | 0.263 | 0.217 | 1.492 | 1.065 | 0.266 | 1.099 | 0.272 | 0.787 | 0.256 |
| Notes: N=693; log likelihood=-1892.60239; Wald chi2 (102)=787.98; likelihood ratio test of rho chi2 (15)=701.843. *, **and *** represent 1%, 5%, and 10% level of significance respectively. | ||||||||||||
Table 10: Result of multivariate probit model.
Conclusion
The role of barley in income generation and food security for smallholder farmers is very high in highland areas of Ethiopia. Adoption of agricultural technologies in Ethiopia appeals to substantial consideration since it can offer the basis for rising production and income.
The finding shows that the relationships among all barley technologies were positive and significant. There is complementarity among improved barley production technologies (urea, DAP, chemicals, iImproved variety, manure, and crop rotation), meaning that the adoption of a given barley technology was conditional on the adoption of the others. Furthermore, higher proportions of adopters (75.99%) were practiced crop rotation; while lower proportions of farmers (58%) adopted urea. The results of a study showed that adopters of barley technologies as compared with non-adopters were characterized by better educational status, higher livestock assets ownership, and higher farm income.
A multivariate probit model result has suggested that ten variables were found to significantly affect adoption of barley technologies. Age of the household head was negative and significantly related to urea and improved variety. The sex of the household head was positive and significantly related to urea, improved variety, manure, and crop rotation. Being a male household head had a higher probability to adopt barley technologies. Education was found to have a positive and significant relationship with the adoption of urea, manure, and improved variety. Therefore, educated barley farmers are expected to be in a good position to get and use agricultural technology availability which contributes to improving their barley production practices. Family size was found to be negatively and significantly affect the adoption of the use of urea improved varieties, manure. This implies the application of more labor for other jobs will affect the adoption of agricultural technologies for barley production negatively.
Farm income was found to positively and significantly related adoption of the use of improved varieties, manure. This implies income is the main source of capital for purchasing agricultural inputs. Transportation cost was negatively and significantly related to the adoption of barley technologies. This implies the rising cost of transportation farmers' consequence of being far away from market centers which might face a lack of information on the availability of the newly released barley technology provided by the extension system.
Recommendation
Based on the results of a study, the following recommendations are suggested to be considered in future intervention policies.
The government should make a policy that empowers femaleheaded households to participate in different institutions and agents of change by considering a widespread and comprehensive development of the country where their involvement is important in all overall country’s development.
Younger household heads are more likely to adopt barley technologies. Hence, the introduction of new agricultural technology in the areas may be effective if it emphasizes more on young farmers. This study provides evidence on the role of credit use in improving the adoption of barley technologies positively; therefore, efforts towards establishing and strengthening microfinance institutions seem crucial. Supporting adequate and effective basic educational opportunities for the rural farmers in Ethiopia is more crucial.
Enhancing the current livestock production system through supplying improved livestock feed, health services, targeted credit, and adopting high-yielding breeds in the areas to improve adoption packages of barley technologies. The government needs to launch a market center for the producers around their home which boosts the livelihood of adoption of barley technologies.
Availability of Data and Materials
The datasets used and analyzed data during the current study are available from the corresponding author on reasonable request.
Acknowledgment
I would like to express my special thanks to Addis Ababa University and my advisor Sisay Debebe (PhD), for his support, guidance, suggestion and encouragement throughout the development of this thesis starting from the inception of the proposal. I would like to thanks my data source Ethiopian Socioeconomic Survey (ESS) data conducted by the CGIAR Standing Panel on Impact Assessment (SPIA) in collaboration with the LSMS-ISA project and the Central Statistical Agency of Ethiopia.
Funding
Not applicable.
Authors and Affiliations
Addis Ababa University School of commerce, Department of Development Economics.
Ermias Getnet and Sisay Debebe.
Contributions
EG, SD contributed to the design and implementation of the research, to the analysis of the results and to the writing of the manuscript. All authors read and approved the final manuscript.
Authors' Information
EG is a MSc holder at Addis Ababa University and Assistant Researcher 1 at Oromia Agricultural Research Inistititute, Sinana Agricultural Research center. Sisay Debebe (PhD) Assistant Professor of Economics, Researcher and Consultant College of Business and Economics, School of Commerce, Addis Ababa University.
Corresponding Author
Correspondence to Ermias Getnet.
Competing Interests
The authors declare that they have no competing interests.
References
- IBC (Institute of Biodiversity Centre). Country report on the states of plant genetic resources. Addis Ababa, Ethiopia. 2009.
- MoARD (Ministry of Agriculture and Rural Development). Federal Democratic Republic of Ethiopia: Ministry of Agriculture and Rural Development; Ethiopia’s agricultural sector Policy And Investment Framework (PIF) 2010-2020, draft final report 15 September 2010,Addis Ababa. 2010.
- Getachew L, Sintayehu D, Tolosa A. Assessing uncomparative advantage of malt barley production in Ethiopia. African crop science conference proceedings. Egypt. 2007;8:1227-1230.
- Daniel T, Beyene D. The status and constraints of food barley production in the North Gondar highlands, North Western Ethiopia. Agric Food Secur. 2019;8(3):1.
- Habtamu A, Bobe B, Enyew A. Fertility status of soils under different land uses at Wujiraba watershed, North-Western highlands of Ethiopia. Agriculture, Forestry and Fisheries. 2014;3(5):410-419.
- Million T, Belay K. Determinants of fertilizer use in Gununo area, Ethiopia. 21-31. In Tesfaye Zegeye, Legesse D, Dawit A. Proceedings of Agricultural technology evaluation adoption and marketing. Workshop held to discuss results of 1998-2002. 2004.
- Deressa TT. Measuring the economic impact of climate change on Ethiopian agriculture: Ricardian approach. World Bank Policy Research Working Paper(4342). 2007.
- Greene WH. Econometric analysis. 5th Edition. New Jersey: Prentice Hall. 2002.
- Priscilla W, Matin Q. Tradeoffs and Complementarities in the Adoption of Improved Seeds, Fertilizer, and Natural Resource Management Technologies in Kenya. Agric Econ. 2016;47(3):351–362.
- Khanna M. Sequential adoption of site-specific technologies and its implications for nitrogen productivity: A double selectivity model. Am J Agric Econ. 2001;83(1):35–51.
- Rahmato N. Determinants of adoption of improved haricot bean production package in alaba special woreda, southern Ethiopia. M. Sc. Thesis rahmeto negash october, 2007 haramaya university. 2007;47.
- MoA (Ministry of Agriculture). Crop variety register. Plant variety release, protection and seed quality control, Directorate. Addis Ababa, Ethiopia. 2018;21:87-95.
- Galmesa A. Adoption of improved soya bean varieties: The case of buno bedele and east wollega zones of oromia region, Ethiopia. MSc thesis, A Thesis Submitted to the School of Agricultural Economics and Agribusiness Postgraduate Program Directorate Haramaya University April. 2018;59-64.
- Samuel A, Donkoh, Shaibu Baanni. Adoption of Improved Agricultural Technologies among Rice Farmers in Ghana: A Multivariate Probit Approach. Ghana Journal of Development Studies. 2019;16(1):50-51.
- De Ridder N, Keulen HV. Some aspects of the role of organic matter in sustainable intensified arable farming system in the west-Africa Semi-Arid-Tropics (SAT). Fert Res. 1990;26:299-310.
Citation: Getnet E, Debebe S (2025) Adoption of Agricultural Technology Packages in Barley Based Farming System of Ethiopia. Agrotechnology. 14:395.
Copyright: © 2025 Getnet E, et al. This is an open access article distributed under the terms of the Creative Commons Attribution License, which permits unrestricted use, distribution, and reproduction in any medium, provided the original author and source are credited.