


Indexed In
- Open J Gate
- Genamics JournalSeek
- JournalTOCs
- China National Knowledge Infrastructure (CNKI)
- Electronic Journals Library
- RefSeek
- Hamdard University
- EBSCO A-Z
- OCLC- WorldCat
- SWB online catalog
- Virtual Library of Biology (vifabio)
- Publons
- MIAR
- Euro Pub
- Google Scholar
Useful Links
Share This Page
Journal Flyer

Open Access Journals
- Agri and Aquaculture
- Biochemistry
- Bioinformatics & Systems Biology
- Business & Management
- Chemistry
- Clinical Sciences
- Engineering
- Food & Nutrition
- General Science
- Genetics & Molecular Biology
- Immunology & Microbiology
- Medical Sciences
- Neuroscience & Psychology
- Nursing & Health Care
- Pharmaceutical Sciences
Review Article - (2019) Volume 10, Issue 5
A Novel Workflow for Using Fiber-Optic Telemetry-Enabled Coiled Tubing in Candidate Selection
Ahmed El-Attar*Received: 20-Sep-2019 Published: 29-Nov-2019, DOI: 10.35248/2157-7463.19.10.398
Abstract
Formation damage is an undesirable operational and economic problem that can occur throughout the lifecycle of oil and gas wells due to several reasons such as using incompatible fluids during workover operations, fines migration, clay swelling, emulsions formation, and scale and organic depositions. Also, newly drilled wells sometimes do not produce optimally due to the damages caused by the drilling fluids. Therefore, addressing formation damage issues to ensure optimum recovery of hydrocarbons needs more efforts on identifying the damage mechanism and quantifying the skin factor. Skin factor is a dimensionless number that reflects the production impairment due to near-wellbore reduction of permeability. So, if this number is zero it means the well is intact, however; if this number is positive that means the well is damaged. The workflow presented in this paper focuses on the use of fiber-optic telemetry-enabled coiled tubing (FOTECT) for production enhancement in real-time by quantifying skin factor, estimating the flow potential and determining the candidate wells for matrix stimulation. This new technology can deliver pressure data in real-time during a typical unloading operation that could be further used in well test analysis for estimating key reservoir properties such as skin (S), flow capacity (Kh), drainage area (A) and initial reservoir pressure (Pi). The new technology reduces the operational time required for well test analysis compared with conventional downhole recording systems (DHR) by two-fold while enabling the performance of an acid treatment in the same run.
Moreover, in this study a workflow and user-interface software using java language were developed to execute the workflow through a two-step streamlined process:
1. Assessing the well damage through quantifying the skin value from pressure transient analysis (PTA) utilizing the downhole pressure data acquired from coiled tubing in real-time.
2. Inflow performance relationship (IPR) construction of the well using Vogel’s correlation and productivity index equation under the current condition and under ideal condition (Zero skin) to assess the feasibility of a stimulation treatment.
The paper will present the application of this technique on simulated field data to show how FOTECT could be used to diagnose and treat the well in the same run. The output obtained from the developed software will be compared against the output of an industry popular well-test suite (Sapphire). Also, a case study in which this technology was used for pressure transient analysis for artificial lift design will be presented to show the applicability of this novel approach and to prove it can yield matching results with conventional techniques in a more efficient way. From the simulated data the developed software estimated the skin factor to be nine from both build-up and draw down analysis, which was later matched by Sapphire commercial Suite; moreover, it was shown that the current production rate of 792-BPOD can be increased to 1722-BOPD post a successful stimulation treatment.
Keywords
Fiber-optic telemetry-enabled coiled tubing; Flow capacity (Kh); Drainage area (A); Initial reservoir pressure (Pi); Conventional downhole recording systems (Dhr)
Abbrevations
CCL: Casing Collar Locator; Ct: Total compressibility, psia-1; CP: Centipoise; CSV: Comma separated value; CT: Coiled Tubing; DHR: Downhole recording; DST: Drill Stem Test; FOTECT: Fiber-Optic Telemetry-Enabled Coiled Tubing; ft: foot; h: Net pay thickness, ft; IARF: Infinite Acting Radial Flow; IPR: Inflow Performance Relationship; J: Productivity index, STB/D-Psi; k: Permeability, md; md: Milli-Darcy; P1 hr: Pressure at 1-hr reading on linear graph, psi; PI: Productivity index, STB/D-Psi; Pi: Initial reservoir pressure, psi; Pr: Average reservoir pressure, psia; PTA: Pressure Transient Analysis; Pwf: Flowing bottom hole pressure, psia; Qo: Oil Production rate, STB/d; Re: Drainage radius; ft; rw: Wellbore radius, ft; S Skin factor, Dimensionless; tp: Production time; hrs; UOM: Unit of Measurement; Δt: Shut-in time, hrs; βo: Oil Formation Volume factor, STB/ res, bbl; μo: Oil viscosity; cp; ∅: Porosity Fraction
Introduction
Nitters et al. [1] indicated that 60 to 70% of matrix stimulation treatments fail worldwide due to a lack of structured approach in candidate selection and treatment design. This high percentage of failure represents millions of dollars wasted due to choosing the wrong candidate and/or a bad design of the stimulation treatment. So, the motive for this study is to introduce and develop a new concept and workflow for performing candidate selection and well treatment simultaneously. This workflow will leverage the capability of the new generation of coiled tubing units of downhole pressure data transmission via fiber-optic telemetry. Acquiring such real-time pressure data will allow the operator to perform real-time pressure transient analysis (PTA), and based on the analysis results, skin factor could be calculated. In case it was concluded that formation damage is present as indicated by appositive skin factor, the same coiled tubing unit could be further used to treat the damage through a well-designed stimulation treatment in the same run saving logistical cost and time. So coiled tubing will be used for both candidate selection and remedial work simultaneously.
Conventionally During pressure transient analysis downhole parameters are commonly measured and registered using downhole memory gauges, which can only be retrieved and analyzed after the end of the well test. The main drawback of this approach is that fluid mobility (K/μ) is usually a key uncertainty before conducting the test. So, test sequence and durations cannot be planned precisely. this jeopardizes the accuracy of the test results, Since, an early-terminated test will yield incomplete set of data resulting in an inaccurate result or the need of repeating the test. And, an unnecessarily-extended test will add up extra costs associated with rig time and unnecessary flaring.
The proposed workflow overcomes the drawbacks of the downhole recording mode (DHR) by conducting dynamic and real-time pressure transient analysis. The real-time pressure data obtained from the pressure sensor deployed with the coiled tubing is the key input required for pressure transient analysis. It can be obtained with coiled tubing during a typical Nitrogen lifting operation (Drawdown analysis), or while the well is shutin and by using an inflatable packer to minimize wellbore storage effects (Pressure build-up analysis). The main advantage over the downhole recording mode (DHR) through memory gauges is that the pressure data is monitored in real-time. So, the well test engineer can adjust the test sequence by identifying wellbore storage period, infinite acting radial flow (IARF) and reaching the boundary. Those benefits will save time and ensure accurate well test analysis [2]. Additionally, the same coiled tubing unit can be used in matrix acidizing treatment to remove skin if test results indicate the presence of formation damage After quantifying the skin factor and ensuring it is due to formation damage (i.e., no mechanical damage is present). Petroleum engineers ensure the effectiveness of the stimulation treatment by studying the inflow performance relationship (IPR) of the well. This step is done to check the production gain value in case skin was removed. The built model performs both tasks which are pressure transient analysis and inflow performance comparison and concludes if the well is a good candidate for matrix stimulation.
Literature Review
Model description and approach
The workflow consists of two basic modules that integrates with each other and are used in series to conclude the final output of the software which is whether a well is candidate for matrix stimulation or not.
The petroleum engineer should confirm that the resulted skin value is only attributable to formation damage (i.e., No pseudoskin) and the economic gain as indicated from the software justifies the expenses associated with carrying out a matrix treatment (costbenefit analysis).
The first module is named “Pressure transient analysis” and is used to carry out the pressure transient analysis by importing the pressure data acquired from the fiber-optic telemetry-enabled coiled tubing (FOTECT) downhole pressure gauges in real-time. They are either input manually as or imported from a comma separate value (CSV) format file. The software can carry-out PTA either in build-up or drawdown mode. It is recommended in build-up analysis to add an inflatable packer to the bottom hole assembly to minimize the wellbore storage effects.
The results obtained from the first module are used to feed the second module which is named “Treatment feasibility study” and is used to perform reservoir performance analysis. It constructs the inflow performance relationship (IPR) of the well in its current condition and under assumed ideal condition (Zero skin). The IPR is either constructed using straight-line productivity index equation or Vogel’s correlation to suit different well conditions and account for the scenario in which the flowing bottom hole pressure (Pwf) is below the bubble point pressure (Pb). After quantifying the skin (S) and obtaining the average permeability thickness (Kh) from module one and calculating the gain that could be achieved if the skin value is brought to zero by a stimulation treatment from module 2. The final decision maker function of the software concludes if the well is a good candidate for matrix stimulation.
Figures 1 and 2 show a flowchart describing the workflow in drawdown and build-up modes respectively.

Figure 1: Candidate selection using FOTECT methodology: Drawdown mode.

Figure 2: Candidate selection using FOTECT methodology: Pressure build-up mode.
Input data
In addition to the real-time pressure data acquired in real-time through the FOTECT, the following data will be needed to run the software [3,4]:
a) Porosity – Fraction
b) Wellbore Radius (rw) – ft
c) Reservoir height (h) – ft
d) Oil formation volume factor βo– res. bbl/STB
e) Oil viscosity μ– cp
f) Initial pressure (Pi) – psia
g) Flow rate (Q) – STB/D
Pressure transient analysis
The model is based on the analytical solution of partial differential equation that describes the fluid flow in the reservoir as a function of time and space (diffusivity equation).
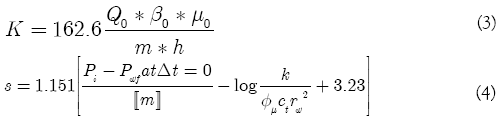
The software uses the semi-log analysis technique to calculate skin and permeability using the below equations:
For Draw Down mode:
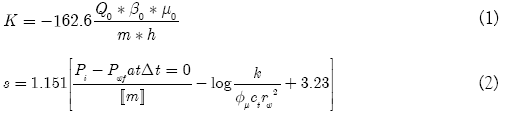
For Build-up mode:
Treatment gain estimation
After skin value is obtained, it should be confirmed that no mechanical damage is present.
Table 1 shows McLeod criteria to identify pseudo skin and identify the treatable skin which is the target of this stud, and then the software uses both straight line productivity index equation and Vogel’s correlation to construct the inflow performance relationship of the well under current conditions and ideal condition (zero skin). This step quantifies the production gain that could be realized if the well damage is treated through a stimulation operation.
| Parameters | Value |
|---|---|
| High liquid gas ration LGR | >100 bbl/MMCF (Gas well) |
| High Gas oil ratio GOR | >1000 Scf/bbl (Oil well) |
| Three Phase Production | (Water, oil and gas) |
| High pressure Drawdown | (Pr-Pwf) > 1000 psi |
| High flow rate | Q/h > 20 BPD/ft |
| Production rate per perforation shot density | Q/N > 5 BPD/Perf. |
| Perforation shot density | < 4 SPF |
| Perforation Phasing | Zero degree phasing |
| Perforation with Small through tubing Gun | Gun diameter less than 2 inches |
| Reservoir pressure | >Pb; While well-bore pressure <Pb |
Table 1: McLeod guidelines to distinguish damages associated to mechanical issues.
For cases where the flowing bottom whole pressure (Pwf) is below the reservoir bubble point pressure (Pb) the straight-line productivity index equation is used to construct the IPR curves.
The software calculates pre-treatment productivity index and post treatment productivity index (PI) from the output data obtained from the first step using the below equations:
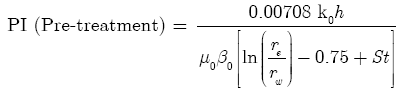 (5)
(5)
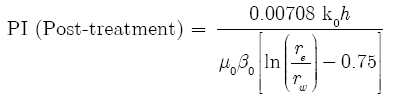 (6)
(6)
Where St in Eq. 6 is set to Zero by default (ideal condition).
Productivity ratio is then estimated which indicates the degree of damage in the well and a very good indicator for candidate selection.
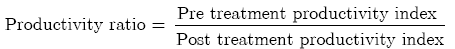 (7)
(7)
Then the oil production rate can be calculated using the basic productivity index equation eq. 8 in the current condition and ideal condition, consequently production gain could be estimated.
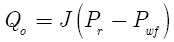 (8)
(8)
The two IPR curves can be plotted on the same sheet to compare and quantify the gain that could be achieved post a successful stimulation treatment that gets skin to zero.
To account for cases in which flowing bottom hole pressure is below the reservoir fluid bubble point pressure. Vogel’s correlation is used to predict the IPR using equations 9 and 10:
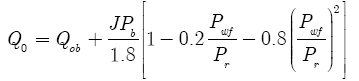 (9)
(9)
Where:
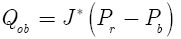 (10)
(10)
The composite IPR graph is then plotted for the pre-treatment curve and another one for the post-treatment IPR curve for the petroleum Engineer to compare and assess the production gain post a stimulation treatment.
Final output: Candidate selection advisor
The final output is a decision-making window indicating whether this well is a candidate for matrix stimulation or not based on skin value, this workflow assumes that the total skin calculated using pressure transient analysis techniques is only attributed to formation damage with zero mechanical (Pseudo-skin).
In case there’s positive skin (Formation damage present) the message generated to the user from the decision-maker module of the software will be that the well is a candidate for matrix stimulation if there’s no pseudo-skin and economic feasibility is assured as shown in the below Figure 3; however, if the skin value is negative the software will hint to the user that an improved wellbore condition is observed as shown in Figure 4.

Figure 3: Candidate selection advisor output: Positive/negative skin.

Figure 4: Inputs of well (A) properties (Software window).
Model validation
A set of simulated field data (Pressure Vs. time) for pressure build up and drawdown was used to validate the software results against commercial industry software, the output delivered from the commercial software will be compared against the output of the developed model.
This validation case proves the capability of this workflow to conclude if a well is a good candidate for matrix stimulation as an output using FOTECT that can be further used to remove the damage in the same run through a well-designed stimulation treatment saving time and cost while delivering better results than the conventional techniques for well testing (DHR).
Validation case: Well (A)
Well (A) is producing from an oil reservoir. A set of well-test simulated data for both pressure build-up and draw-down analysis is used for executing the workflow. The set of data is assumed to be obtained from the FOTECT (Pressure Vs Time) and is presented in Table 2 along with the input parameters (reservoir properties, oil properties and production parameters) in Tables 3 and 4 required for pressure transient analysis and inflow performance relationship construction [5].
| Time | Pressure | Liquid Rate | Time | Pressure | Liquid Rate | Time | Pressure | Liquid Rate |
|---|---|---|---|---|---|---|---|---|
| (hr) | (psia) | (STB/D) | (hr) | (psia) | (STB/D) | (hr) | (psia) | (STB/D) |
| - | 4,997 | 1000 | 108.03 | 569 | 1000 | 213.53 | 4,655 | 0 |
| 0 | 4,984 | 1000 | 109.53 | 568 | 1000 | 215.03 | 4,668 | 0 |
| 0.01 | 4,972 | 1000 | 111.03 | 566 | 1000 | 216.53 | 4,680 | 0 |
| 0.01 | 4,960 | 1000 | 112.53 | 564 | 1000 | 218.03 | 4,690 | 0 |
| 0.01 | 4,947 | 1000 | 114.03 | 563 | 1000 | 219.53 | 4,700 | 0 |
| 0.02 | 4,935 | 1000 | 115.53 | 561 | 1000 | 221.03 | 4,709 | 0 |
| 0.02 | 4,923 | 1000 | 117.03 | 560 | 1000 | 222.53 | 4,717 | 0 |
| 0.02 | 4,911 | 1000 | 118.53 | 558 | 1000 | 224.03 | 4,724 | 0 |
| 0.02 | 4,898 | 1000 | 120.03 | 557 | 1000 | 225.53 | 4,731 | 0 |
| 0.03 | 4,886 | 1000 | 121.53 | 555 | 1000 | 227.03 | 4,738 | 0 |
| 0.03 | 4,873 | 1000 | 123.03 | 554 | 1000 | 228.53 | 4,744 | 0 |
| 0.03 | 4,858 | 1000 | 124.53 | 552 | 1000 | 230.03 | 4,750 | 0 |
| 0.04 | 4,842 | 1000 | 126.03 | 551 | 1000 | 231.53 | 4,755 | 0 |
| 0.04 | 4,823 | 1000 | 127.53 | 549 | 1000 | 233.03 | 4,760 | 0 |
| 0.05 | 4,803 | 1000 | 129.03 | 548 | 1000 | 234.53 | 4,765 | 0 |
| 0.05 | 4,780 | 1000 | 130.53 | 547 | 1000 | 236.03 | 4,770 | 0 |
| 0.06 | 4,754 | 1000 | 132.03 | 545 | 1000 | 237.53 | 4,774 | 0 |
| 0.07 | 4,726 | 1000 | 133.53 | 544 | 1000 | 239.03 | 4,778 | 0 |
| 0.08 | 4,694 | 1000 | 135.03 | 543 | 1000 | 240.53 | 4,782 | 0 |
| 0.09 | 4,659 | 1000 | 136.53 | 541 | 1000 | 242.03 | 4,786 | 0 |
| 0.1 | 4,620 | 1000 | 138.03 | 540 | 1000 | 243.53 | 4,789 | 0 |
| 0.11 | 4,577 | 1000 | 139.53 | 539 | 1000 | 245.03 | 4,793 | 0 |
| 0.12 | 4,529 | 1000 | 141.03 | 537 | 1000 | 246.53 | 4,796 | 0 |
| 0.14 | 4,477 | 1000 | 142.53 | 536 | 1000 | 248.03 | 4,799 | 0 |
| 0.15 | 4,418 | 1000 | 144.03 | 535 | 1000 | 249.53 | 4,802 | 0 |
| 0.17 | 4,354 | 1000 | 145.53 | 534 | 1000 | 251.03 | 4,805 | 0 |
| 0.19 | 4,284 | 1000 | 147.03 | 532 | 1000 | 252.53 | 4,808 | 0 |
| 0.24 | 4,124 | 1000 | 150.03 | 530 | 1000 | 255.53 | 4,814 | 0 |
| 0.27 | 4,032 | 1000 | 151.53 | 529 | 1000 | 257.03 | 4,816 | 0 |
| 0.3 | 3,933 | 1000 | 153.03 | 528 | 1000 | 258.53 | 4,819 | 0 |
| 0.34 | 3,826 | 1000 | 154.53 | 526 | 1000 | 260.03 | 4,821 | 0 |
| 0.38 | 3,711 | 1000 | 156.03 | 525 | 1000 | 261.53 | 4,823 | 0 |
| 0.43 | 3,588 | 1000 | 157.53 | 524 | 1000 | 263.03 | 4,826 | 0 |
| 0.48 | 3,458 | 1000 | 159.03 | 523 | 1000 | 264.53 | 4,828 | 0 |
| 0.54 | 3,319 | 1000 | 160.53 | 522 | 1000 | 266.03 | 4,830 | 0 |
| 0.6 | 3,174 | 1000 | 162.03 | 521 | 1000 | 267.53 | 4,832 | 0 |
| 0.68 | 3,023 | 1000 | 163.53 | 520 | 1000 | 269.03 | 4,834 | 0 |
| 0.76 | 2,866 | 1000 | 165.03 | 519 | 1000 | 270.53 | 4,836 | 0 |
| 0.85 | 2,706 | 1000 | 166.53 | 518 | 1000 | 272.03 | 4,838 | 0 |
| 0.96 | 2,545 | 1000 | 168.03 | 516 | 1000 | 273.53 | 4,840 | 0 |
| 1.07 | 2,383 | 1000 | 169.53 | 515 | 1000 | 275.03 | 4,842 | 0 |
| 1.21 | 2,223 | 1000 | 171.03 | 514 | 1000 | 276.53 | 4,843 | 0 |
| 1.35 | 2,068 | 1000 | 172.53 | 513 | 1000 | 278.03 | 4,845 | 0 |
| 1.52 | 1,918 | 1000 | 174.03 | 512 | 1000 | 279.53 | 4,847 | 0 |
| 1.7 | 1,778 | 1000 | 175.53 | 511 | 1000 | 281.03 | 4,848 | 0 |
| 1.91 | 1,647 | 1000 | 177.03 | 510 | 1000 | 282.53 | 4,850 | 0 |
| 2.14 | 1,528 | 1000 | 178.53 | 509 | 1000 | 284.03 | 4,851 | 0 |
| 2.41 | 1,421 | 1000 | 180.03 | 508 | 1000 | 285.53 | 4,853 | 0 |
| 2.7 | 1,326 | 1000 | 181.53 | 507 | 1000 | 287.03 | 4,854 | 0 |
| 3.03 | 1,244 | 1000 | 183.03 | 506 | 1000 | 288.53 | 4,856 | 0 |
| 3.4 | 1,175 | 1000 | 184.53 | 505 | 1000 | 290.03 | 4,857 | 0 |
| 3.81 | 1,116 | 1000 | 186.03 | 504 | 1000 | 291.53 | 4,859 | 0 |
| 4.28 | 1,066 | 1000 | 187.53 | 503 | 1000 | 293.03 | 4,860 | 0 |
| 4.8 | 1,025 | 1000 | 189.03 | 502 | 1000 | 294.53 | 4,861 | 0 |
| 5.39 | 991 | 1000 | 190.53 | 501 | 1000 | 296.03 | 4,863 | 0 |
| 6.04 | 962 | 1000 | 192.03 | 501 | 1000 | 297.53 | 4,864 | 0 |
| 6.78 | 938 | 1000 | 193.53 | 500 | 1000 | 299.03 | 4,865 | 0 |
| 7.61 | 916 | 1000 | 195.03 | 499 | 1000 | 300.53 | 4,866 | 0 |
| 8.54 | 897 | 1000 | 196.53 | 498 | 1000 | 302.03 | 4,868 | 0 |
| 9.58 | 879 | 1000 | 198.03 | 497 | 1000 | 303.53 | 4,869 | 0 |
| 10.75 | 862 | 1000 | 199.53 | 496 | 1000 | 305.03 | 4,870 | 0 |
| 12.06 | 846 | 1000 | 199.77 | 496 | 1000 | 306.53 | 4,871 | 0 |
| 13.53 | 830 | 1000 | 200 | 496 | 1000 | 308.03 | 4,872 | 0 |
| 15.03 | 816 | 1000 | 200 | 508 | 0 | 309.53 | 4,873 | 0 |
| 18.03 | 792 | 1000 | 200.01 | 533 | 0 | 312.53 | 4,875 | 0 |
| 19.53 | 782 | 1000 | 200.01 | 545 | 0 | 314.03 | 4,876 | 0 |
| 21.03 | 772 | 1000 | 200.01 | 558 | 0 | 315.53 | 4,877 | 0 |
| 22.53 | 763 | 1000 | 200.02 | 570 | 0 | 317.03 | 4,878 | 0 |
| 24.03 | 755 | 1000 | 200.02 | 582 | 0 | 318.53 | 4,879 | 0 |
| 25.53 | 747 | 1000 | 200.02 | 594 | 0 | 320.03 | 4,880 | 0 |
| 27.03 | 740 | 1000 | 200.03 | 606 | 0 | 321.53 | 4,881 | 0 |
| 28.53 | 733 | 1000 | 200.03 | 620 | 0 | 323.03 | 4,882 | 0 |
| 30.03 | 726 | 1000 | 200.03 | 634 | 0 | 324.53 | 4,883 | 0 |
| 31.53 | 720 | 1000 | 200.04 | 651 | 0 | 326.03 | 4,884 | 0 |
| 33.03 | 714 | 1000 | 200.04 | 669 | 0 | 327.53 | 4,885 | 0 |
| 34.53 | 709 | 1000 | 200.05 | 690 | 0 | 329.03 | 4,886 | 0 |
| 36.03 | 703 | 1000 | 200.05 | 713 | 0 | 330.53 | 4,886 | 0 |
| 37.53 | 698 | 1000 | 200.06 | 738 | 0 | 332.03 | 4,887 | 0 |
| 39.03 | 693 | 1000 | 200.07 | 767 | 0 | 333.53 | 4,888 | 0 |
| 40.53 | 689 | 1000 | 200.08 | 798 | 0 | 335.03 | 4,889 | 0 |
| 42.03 | 684 | 1000 | 200.09 | 833 | 0 | 336.53 | 4,890 | 0 |
| 43.53 | 680 | 1000 | 200.1 | 872 | 0 | 338.03 | 4,890 | 0 |
| 45.03 | 676 | 1000 | 200.11 | 916 | 0 | 339.53 | 4,891 | 0 |
| 46.53 | 672 | 1000 | 200.12 | 963 | 0 | 341.03 | 4,892 | 0 |
| 48.03 | 668 | 1000 | 200.14 | 1,016 | 0 | 342.53 | 4,893 | 0 |
| 49.53 | 664 | 1000 | 200.15 | 1,074 | 0 | 344.03 | 4,893 | 0 |
| 51.03 | 660 | 1000 | 200.17 | 1,138 | 0 | 345.53 | 4,894 | 0 |
| 52.53 | 657 | 1000 | 200.19 | 1,208 | 0 | 347.03 | 4,895 | 0 |
| 54.03 | 653 | 1000 | 200.21 | 1,285 | 0 | 348.53 | 4,896 | 0 |
| 55.53 | 650 | 1000 | 200.24 | 1,369 | 0 | 350.03 | 4,896 | 0 |
| 57.03 | 647 | 1000 | 200.27 | 1,460 | 0 | 351.53 | 4,897 | 0 |
| 58.53 | 643 | 1000 | 200.3 | 1,559 | 0 | 353.03 | 4,898 | 0 |
| 60.03 | 640 | 1000 | 200.34 | 1,666 | 0 | 354.53 | 4,898 | 0 |
| 61.53 | 637 | 1000 | 200.38 | 1,781 | 0 | 356.03 | 4,899 | 0 |
| 63.03 | 634 | 1000 | 200.43 | 1,904 | 0 | 357.53 | 4,900 | 0 |
| 64.53 | 632 | 1000 | 200.48 | 2,035 | 0 | 359.03 | 4,900 | 0 |
| 66.03 | 629 | 1000 | 200.54 | 2,173 | 0 | 360.53 | 4,901 | 0 |
| 67.53 | 626 | 1000 | 200.6 | 2,318 | 0 | 362.03 | 4,901 | 0 |
| 69.03 | 623 | 1000 | 200.68 | 2,470 | 0 | 363.53 | 4,902 | 0 |
| 70.53 | 621 | 1000 | 200.76 | 2,626 | 0 | 365.03 | 4,903 | 0 |
| 72.03 | 618 | 1000 | 200.85 | 2,786 | 0 | 366.53 | 4,903 | 0 |
| 75.03 | 613 | 1000 | 201.07 | 3,109 | 0 | 369.53 | 4,904 | 0 |
| 76.53 | 611 | 1000 | 201.21 | 3,269 | 0 | 371.03 | 4,905 | 0 |
| 78.03 | 608 | 1000 | 201.35 | 3,424 | 0 | 372.53 | 4,906 | 0 |
| 79.53 | 606 | 1000 | 201.52 | 3,573 | 0 | 374.03 | 4,906 | 0 |
| 81.03 | 604 | 1000 | 201.7 | 3,714 | 0 | 375.53 | 4,907 | 0 |
| 82.53 | 602 | 1000 | 201.91 | 3,845 | 0 | 377.03 | 4,907 | 0 |
| 84.03 | 600 | 1000 | 202.14 | 3,964 | 0 | 378.53 | 4,908 | 0 |
| 85.53 | 597 | 1000 | 202.41 | 4,071 | 0 | 380.03 | 4,908 | 0 |
| 87.03 | 595 | 1000 | 202.7 | 4,165 | 0 | 381.53 | 4,909 | 0 |
| 88.53 | 593 | 1000 | 203.03 | 4,246 | 0 | 383.03 | 4,909 | 0 |
| 90.03 | 591 | 1000 | 203.4 | 4,316 | 0 | 384.53 | 4,910 | 0 |
| 91.53 | 589 | 1000 | 203.81 | 4,375 | 0 | 386.03 | 4,910 | 0 |
| 93.03 | 587 | 1000 | 204.28 | 4,424 | 0 | 387.53 | 4,911 | 0 |
| 94.53 | 585 | 1000 | 204.8 | 4,464 | 0 | 389.03 | 4,911 | 0 |
| 96.03 | 583 | 1000 | 205.39 | 4,498 | 0 | 390.53 | 4,912 | 0 |
| 97.53 | 582 | 1000 | 206.04 | 4,527 | 0 | 392.03 | 4,912 | 0 |
| 99.03 | 580 | 1000 | 206.78 | 4,551 | 0 | 393.53 | 4,913 | 0 |
| 100.53 | 578 | 1000 | 207.61 | 4,572 | 0 | 395.03 | 4,913 | 0 |
| 102.03 | 576 | 1000 | 208.54 | 4,591 | 0 | 396.53 | 4,914 | 0 |
| 103.53 | 574 | 1000 | 209.58 | 4,608 | 0 | 398.03 | 4,914 | 0 |
| 105.03 | 573 | 1000 | 210.75 | 4,624 | 0 | 399.53 | 4,915 | 0 |
| 106.53 | 571 | 1000 | 212.06 | 4,640 | 0 | 400 | 4,915 | 0 |
Table 2: Simulated data used for validation example.
| Reservoir parameters | Value |
|---|---|
| Porosity (Φ) | 0.1 |
| Wellbore Radius (rw) - ft | 0.3 |
| Total Compressibility (Ct) - Psia-1 | 3.00E-06 |
| Reservoir Height (h) - ft | 30 |
Table 3: Assumed reservoir parameters for validation example.
| Oil properties | Value |
|---|---|
| Oil Formation Volume Factor (βo) – Res bbl/STB | 1.2 |
| Viscosity (µo) - cp | 0.8 |
| Bubble point Pressure (Pb) - psia | 2000 |
Table 4: Assumed oil properties for validation example.
The well is diagnosed to be damaged (Positive skin of 9.4) is calculated from the pressure transient analysis module and then the well potential is calculated at (Pwf=zero) using this skin value and under ideal conditions using both productivity index equation and Vogel’s correlation to show the improvement that could be realized post a successful damage removal operation. All results are tabulated in Table 5.
| Production parameters | Value |
|---|---|
| Initial pressure (Pi) - psia | 4997 |
| Flow rate (Qo) – STB/D | 1000 |
| Production time (tp) - hrs | 200 |
Table 5: Assumed production parameters for validation example.
In this case the software concludes that the well is candidate for matrix stimulation in case no mechanical damage is present and if economic feasibility is assured.
Figure 4 shows the input window of the developed software with all the reservoir, oil and production parameters. Figure 5 shows the semi-log representation of the pressure data for drawdown and build up analysis conducted by the software and Figure 6 shows the output of module one for pressure transient analysis of permeability, skin, and radius of investigation. All results are summarized in Table 6.

Figure 5: Semi-log plot of simulated data for drawdown/build up analysis.

Figure 6: Software output for drawdown/build up analysis.
| Parameters | Workflow | ||
|---|---|---|---|
| Developed software | Sapphire | Absolute error | |
| Pressure transient analysis (Drawdown) | |||
| Skin Factor | 9.53 | 9.89 | 2.70% |
| Permeability - md | 18.82 | 19.2 | 1.90% |
| Pressure transient analysis (Build-up) | |||
| Skin Factor | 9.42 | 9.8 | 3.80% |
| Permeability - md | 18.71 | 19.2 | 2.50% |
| Inflow performance relationship (Pre-treatment) | |||
| Well Potential - Darcy Eq. STB/D | 1220 | 1217 | 0.20% |
| Well Potential - Vogel's correlation STB/D | 986 | 986 | 0% |
| Inflow performance relationship (Post-treatment) | |||
| Well Potential - Darcy Eq. STB/D | 2743 | 2740 | 0.10% |
| Well Potential - Vogel's correlation STB/D | 2220 | 2220 | 0% |
Table 6: Summary of outputs of sapphire and well-master for PTA and IPR.
While Figure 7 shows the input for the second module of the software which is used to construct the IPR curves. Figure 8 shows the software generated IPR curves using productivity index equation and Vogel’s correlation under ideal and current conditions. Production rates tabulated are estimated at an assumed flowing BHP of 1,500-psi

Figure 7: Inputs for treatment feasibility section.

Figure 8: Software generated IPRs (Vogel and straight-line).
The results of modules 1 and 2 are used to determine whether the well is candidate for matrix stimulation or not provided that economic feasibility is assured and no mechanical damage present and the output for this example is shown in Figure 9.

Figure 9: Candidate selection advisor results.
Figures 10-13 Shows the execution steps using the Sapphire Ecrin module for pressure transient analysis and IPR curves using straight-line productivity index equation and Vogel’s correlation.

Figure 10: Input window for sapphire for PTA. Courtesy of Kappa.

Figure 11: Type curve matching using sapphire.

Figure 12: Sapphire Vogel IPR (Ideal case-left – Damaged case-right).

Figure 13: Sapphire Darcy law IPR (Ideal case-left – damaged case-right).
A tabulated summary of the results comparison between the developed software and the commercial software is given in Table 6 and visually presented in Figures 14 and 15.

Figure 14: Comparison between developed software and Sapphire output for PTA.

Figure 15: Comparison between developed software and Sapphire output for IPR.
Results and Discussion
A field application is discussed to prove the viability of this technology on performing pressure transient analysis and to show its advantages over conventional techniques (DHR on memory gauges)
The technology was tried in one well in shushufindi field in Ecuador [6,7], the main objective of the operation was to evaluate the well and perform pressure transient analysis for artificial lift design. Historically pressure data required for well test analysis was acquired by deploying memory gauges into the production tubing; however, some challenges were faced during well testing operations that encouraged the operator to try the fiber-optic telemetry enabled coiled tubing (FOETCT) for well testing [8]. Those problems were:
1. Ineffective closure caused by debris found in ball’s seat when using conventional shut-in method with memory gauges and standing valves.
2. Long test times due to wellbore storage effects and uncertainty about data completeness during well testing.
3. Operational issues related to slickline running of memory gauges.
To overcome the above challenges, a fiber-optic telemetry-enabled coiled tubing intervention was deployed to perform PTA in realtime. In this operation the down hole real-time pressure gauge will run in conjunction with an inflatable packer to minimize wellbore storage effects.
It was reported that the real-time monitoring of the downhole parameters with pressure and temperature sensors provided a positive confirmation of well inflow, reducing risk associated with running memory gauges. Additionally, it presented a safer way for artificial lift design to avoid non-productive time associated with waiting-on-equipment and extended rig operation [9].
The operational outline of the coiled tubing intervention was executed according to the below steps:
1. Drawdown testing was mainly conducted using N2 Lifting as a well kick-off method.
2. A mechanical tubing packer (Mechanical-set) and a double flapper check valve were used in the bottomhole assembly (BHA) to allow for downhole shut-in and prevent reservoir fluids from entering the CT workstring.
3. Real-time CCL measurement allowed for accurate placement of the BHA during well test analysis.
4. A surface acquisition system was used to receive the downhole measurements and allow well test engineers to perform well test interpretation in real-time
5. In summary, the use of this technology in shushufindi field in Ecuador [7] proved to provide matching results with conventional techniques. The well test analysis was made in less time due to real-time monitoring and the use of mechanical-packer that minimized wellbore storage effects. The ability to perform multiple applications in the same intervention, stimulation or logging for example greatly enhances the economics of the intervention operation.
Conclusion
Formation damage is one of the prominent reasons why oil and gas wells are not operating to their full capacity. Failure rate is also so high in executing stimulation jobs due to lack of following a structured approach in candidate selection and damage identification. Well test analysis is one of the key petroleum engineering aspects for quantifying damage and identifying candidates for stimulation; however, the conventional methods (DHR) used for PTA are ineffective and time consuming due to the risks associated with running memory gauges into completion nipples and the inability to read and optimize the test in real-time since all the data is being recorded downhole. Moreover, in case a well damage is identified, extra time will be needed to mobilize CT equipment for well stimulation.
This study tried to overcome all those hurdles by designing a new workflow that enables petroleum engineers to diagnose and treat the problem in the same run. This workflow relies mainly on pressure transient analysis (PTA) as a key technique for candidate selection through skin quantifications and inflow performance relationship analysis (IPR). The added values of the new workflow could be summarized in the below points:
1. The workflow avoided the drawbacks of conventional downhole recording (DHR) techniques for pressure data acquisition. As they frequently render inaccurate results or cause additional operational costs. So, the workflow relies on pressure data obtained by fiber-optic telemetry-enabled coiled tubing (FOTECT) as a communication medium for real-time well test analysis.
2. This workflow aims at adding a value of maximizing recovery levels using a streamlined study. This study combines the benefits of real-time well test analysis while leveraging the capability of the coiled tubing as a pumping medium to do perform stimulation job. So, diagnosis and remedial will be done with coiled tubing.
3. This new approach will save rig time due to optimized well test timing sequence. Also, save logistical time required to mobilize coiled tubing unit for remedial operation after identifying formation damage by combining both in the same run.
REFERENCES
- Nitterss G, Roodhart L, Jongma H, Yeager V, Bujise M. A structured approach to candidate selection and matrix treatment design. SPE Paper.2000;53:1.
- Bourdet D. Well test analysis. Elsevier science (1st edn). 2002;44:59.
- Holditch S A, Xiong HA. comprehensive approach to formation damage diagnosis and corresponding stimulation type and fluid selection. Paper SPE 29531. 1995;2:4.
- Bennion DB, Thomas FB, Bennion DW, Bietz RF. Mechanisms of formation damage and permeability impairment associated with the drilling, completion and production of low API gravity oil reservoirs. paper SPE-30320. 1995; 1.
- Jennings AR. Good wells make the best candidates for well stimulation. Paper SPE-19738-PA.1991;1.
- Saavedra N, Solano R, Gidley J, Reyes CA, Rodriguez P, Kondo F, et al. Well screening for matrix stimulation treatment. Paper published on Science, Technology and Future journal, Colombian Petroleum Institute, USA. 1998;1:11.
- Villanueva G, Burgos J. Optimizing well evaluation: Real time monitoring using fiber optic conveyed in coiled tubing and N2 lifting. Paper SPE-177107-MS. 2015;1:10.
- McLeod HO. Significant factors for successful matrix acidizing. Paper SPE 20155. 1989;176.
- Schlumberger D. Log Interpretation Charts. Matrix Engineering Manual. 1998;1:50.
Citation: El-Attar A (2019) A Novel Workflow for Using Fiber-Optic Telemetry-Enabled Coiled Tubing in Candidate Selection. J Pet Environ Biotechnol. 10:398. doi: 10.35248/2157-7463.19.10.398
Copyright: © 2019 El-Attar A, et al. This is an open-access article distributed under the terms of the Creative Commons Attribution License, which permits unrestricted use, distribution, and reproduction in any medium, provided the original author and source are credited.